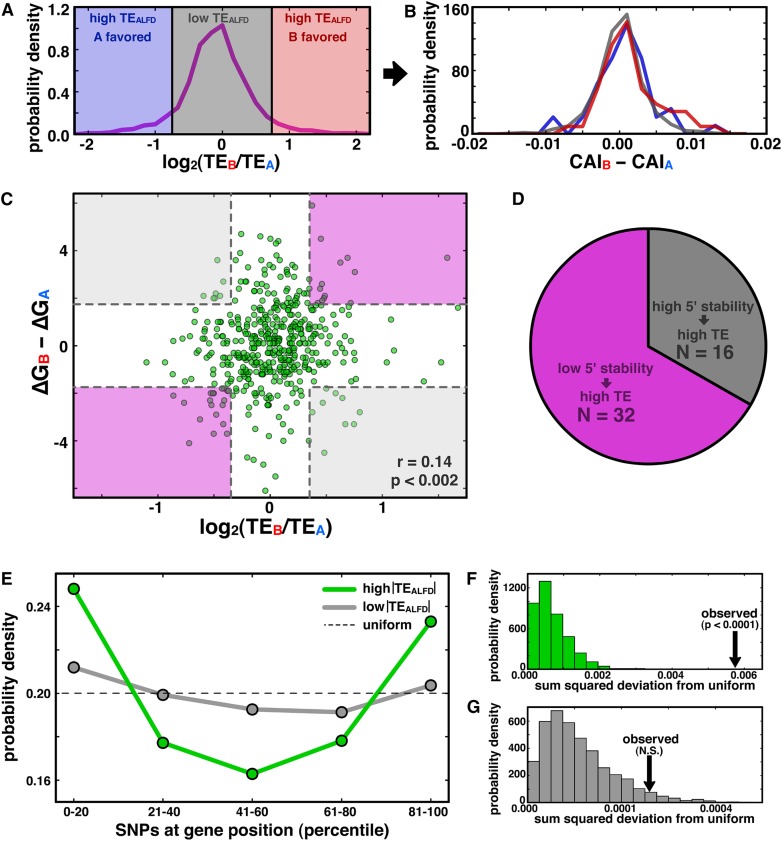
Figure 5.
mRNA structure stability near start codon and SNP positioning near termini correlate with translational ASE bias. (A) Genes with high TEALFD are shaded in blue and red, and those with low TEALFD are shaded gray. (B) Allelic disparities in codon bias are not different among the gene sets in A. (C) Scatterplot of TEALFD versus the difference in predicted folding energy of the 60-nt window surrounding the start codon for all genes with at least one SNP in the window. Shading indicates regions that are at least one standard deviation away from zero on each axis, with purple regions representing the expected relationship between structure stability and TE, and gray indicating the unexpected relationship. (D) Pie chart quantifying the number of genes falling in each region demarcated in C. (E) PDF of SNP density as a function of position for genes with high (green) or low (gray) TEALFD (see Methods); the dashed line shows the uniform distribution. (F,G) PDFs indicating the sum-squared deviation from the uniform distribution from permutation analyses for genes with high (F) and low (G) TEALFD (see Methods); observed values indicated by black arrows.

