Figure 6.
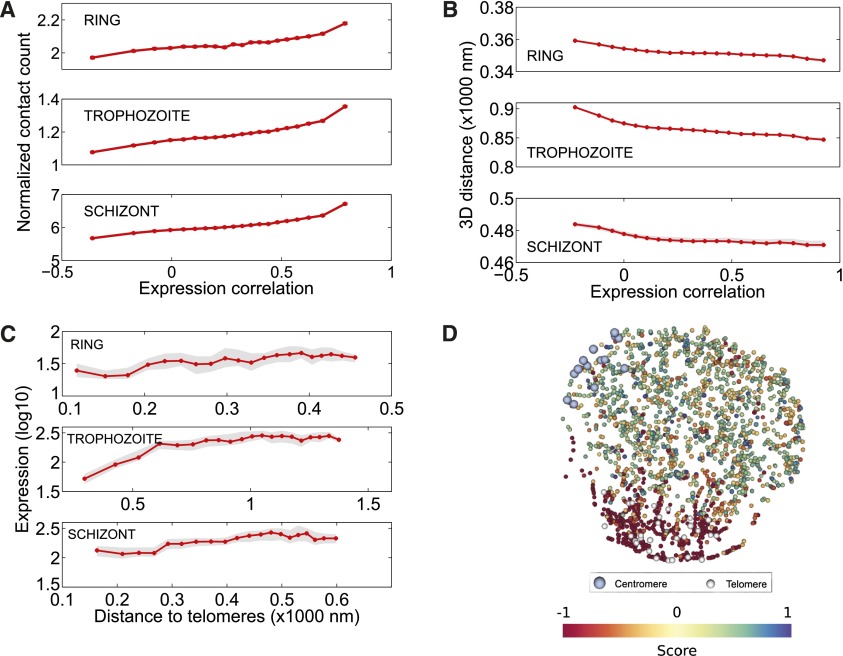
Relationship between 3D architecture and gene expression. (A) Correlation between expression profiles of pairs of interchromosomal genes as a function of number of contacts linking the two genes. To generate this plot, all interchromosomal gene pairs are first sorted in increasing order of their expression correlation and then binned into 20 equal width quantiles (fifth, 10th, …, 100th). For each bin, the average expression correlation between gene pairs (x-axis) and the average normalized contact count linking the genes in each pair together with its standard error (y-axis) are computed and plotted. Interchromosomal gene pairs that have contact counts within the top 20% for each stage have more highly correlated expression profiles than the remaining gene pairs (Wilcoxon rank-sum test, P-values 2.48 × 10−206 [ring], 0 [trophozoite], and 0 [schizont]). (B) Correlation between expression profiles of pairs of interchromosomal genes as a function of 3D distance between the genes. This plot is generated similarly to A but using 3D distances instead of contact counts (y-axis). In order to summarize results from multiple 3D structures per each stage, we plot the median value among 100 structures with a red line and shade the region corresponding to the interval between the fifth and 95th percentile with gray. Interchromosomal gene pairs closer than 20% of the nuclear diameter have more highly correlated expression profiles than genes that are far apart (Wilcoxon rank-sum test, P-values 7.17 × 10−221 [ring], 0 [trophozoite], and 1.57 × 10−88 [schizont]). (C) Gene expression as a function of distance to telomeres. To generate this plot all genes are first sorted by increasing distance to the centroid of telomeres (x-axis) and then binned similar to A into 20 equal width quantiles. The average log expression value (Bunnik et al. 2013) together with its standard error (y-axis) is plotted for genes in each bin. In order to summarize results from multiple 3D structures per each stage, we plot the median value among 100 structures with a red line and shade the region corresponding to the interval between fifth and 95th percentile with gray. Genes that lie within 20% of the nuclear diameter to the centroid of the telomeres showed significantly lower expression levels (Wilcoxon rank-sum test, P-values 1.54 × 10⁻¹² [ring], 1.69 × 10⁻³² [trophozoite], 3.37 × 10⁻²⁰ [schizont]). (D) First KCCA expression profile component score, corresponding to the projection of the gene expression profile onto the extracted KCCA profile for the trophozoite stage.

