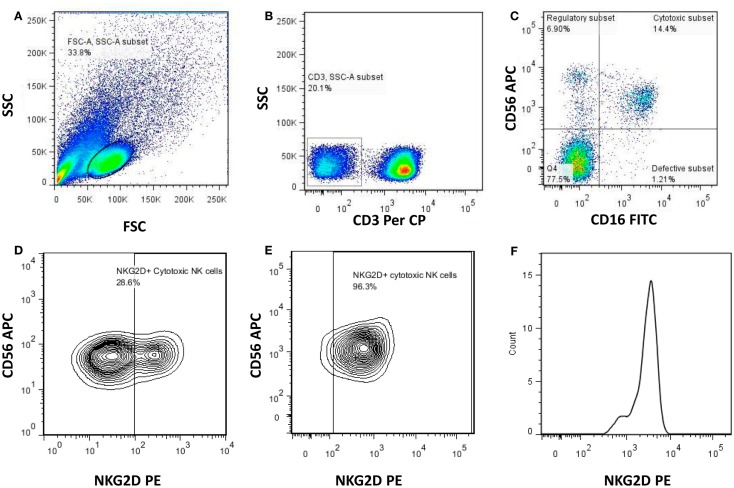
Figure 1.
Gating strategy used to identify NK cells and the NK cell subsets. Representative flowcytometry plots from the PBMCs of one of the study participants. The lymphocytes were live gated during acquisition using the side and forward scatter dot plot display (A). Furthermore, by using the negative gating strategy, CD3-negative lymphocyte population was identified (B). The NK cell population was further identified and differentiated into regulatory (CD3−CD16−CD56+), cytotoxic (CD3−CD16+CD56+), and defective (CD3−CD16+CD56−) NK cell subsets on the basis of the expression of CD56 and CD16 (C). Representative contour plot to demonstrate discrimination between positive and negative population for the presence of NK cell receptor (NKG2D) (RHI-HVL) (D). Representative contour plot to demonstrate discrimination between positive and negative population for the presence of NK cell receptor (NKG2D) (LTNP) (E). Representative histogram of positive population to denote histogram analysis of each of the NK cell subset to determine G-MFI of NK cell receptors (NKG2D) (F).

