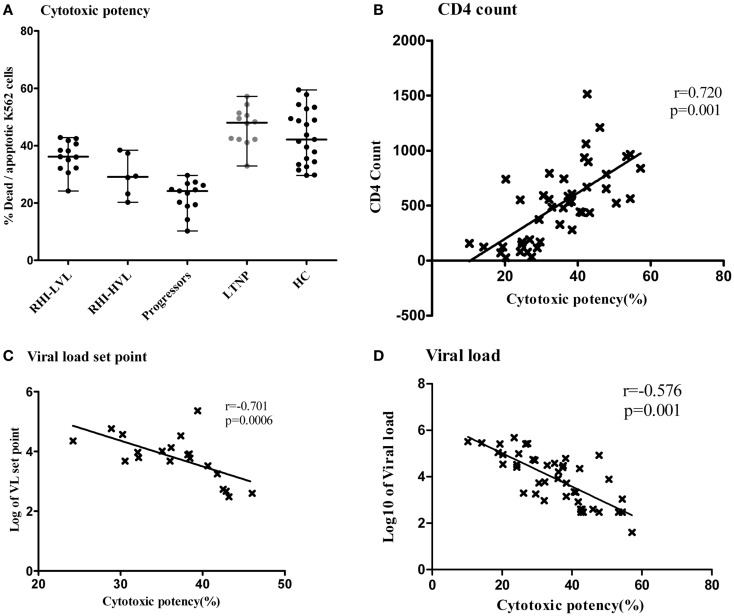
Figure 7.
Cytotoxic potency of NK cells in study participants. The vertical scatter plot shows the percentages of lysed target cells (Y axis) as a measure of cytotoxic potency of the NK cells from all the study groups (X axis). LTNPs showed highest cytotoxic potency (Dots are highlighted by gray color) (A). Association of cytotoxic potency of NK cells (X axis) with the markers of disease progression on y axis; the CD4 count (B) and the plasma viral load set point (C) and viral load at enrollment visit in HIV-1 infected study participants (D).

