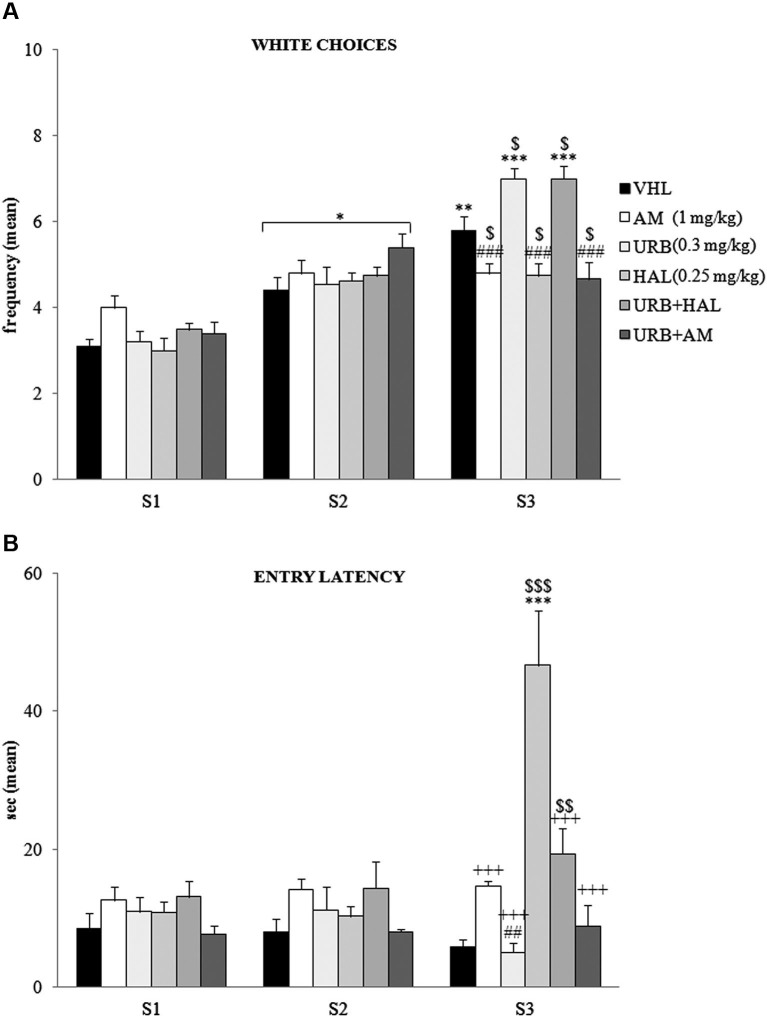
Figure 2.
Behavioral effects of A/A Y-Maze. (A) Between S1 and S2, all animals displayed a significant (at least p = 0.02, *) increase in white choices. Between S2 and S3, the VHL (p = 0.006, **), URB (p = 0.0001, ***) and URB+HAL (p = 0.0001, ***) groups increased their white choices, while the AM, URB+AM and HAL groups did not. The significant post hoc comparisons of the intergroup differences in S3 were: URB (or URB+HAL) vs. AM or HAL or URB+AM: p = 0.0002, ###; VHL vs. all the other groups: at leastp = 0.05, $. (B) Between S1 and S2, no significant differences in entry latency were found. Between S2 and S3, the HAL group had higher latency values (p < 0.0001, ***). In S3, the HAL group showed highest entry latency values (vs. URB, URB+HAL, AM, URB+AM groups at least p = 0.0001, +++; vs. VHL group p = 0.0001, $$$). The haloperidol powerful effect was contrasted but not prevented by URB597 and haloperidol coadministration, as the URB+HAL group had higher latency values than the URB (p = 0.002, ##) and VHL (p = 0.005, $$) groups.

