Figure 3.
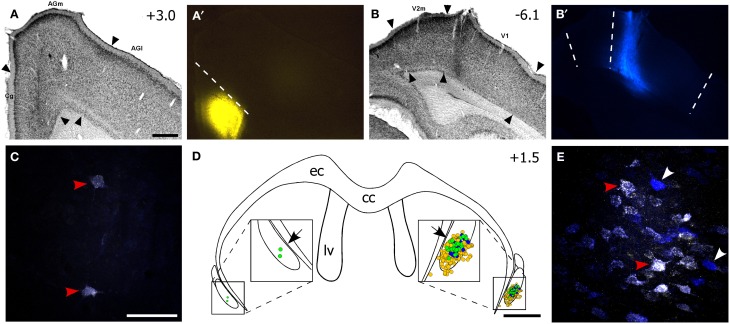
The ventral claustrum projects to both FEF and V1. (A–B′) Fluorogold (FG) deposit in FEF and True Blue (TB) in V1 of the right hemisphere for the same case in Figure 2. (C) Confocal image of two faintly double-labeled neurons in the left vCLA. (D) Reconstruction of labeled soma in the vCLA. Yellow and blue dots are FG- and TB-labeled soma, respectively, and green dots are double-labeled neurons. Black arrows indicate areas in (C,E). (E) Confocal image of multiple retrogradely-labeled neurons in the right CLA. Red arrowheads in (C,E) indicate double-labeled neurons, white arrowheads indicate TB-labeled neurons. Scale bars: 500 μm in (A); 50 μm in (C); 1 mm in (D).

