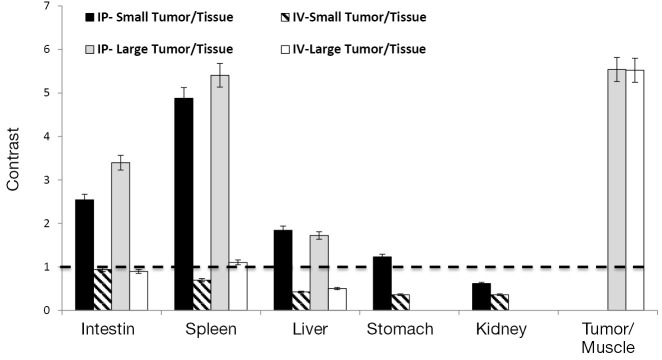
Figure 3.

Quantification of the NIRF signal with a tumor to organ ratio. The contrast (y-axis) was calculated by dividing the fluorescence intensity of tumors to it of specific tissues. High background organ signals resulted in poor contrasts (≤1). NIRF, protease-activated near-infrared fluorescence; IP, intraperitoneal; IV, intravenous.
