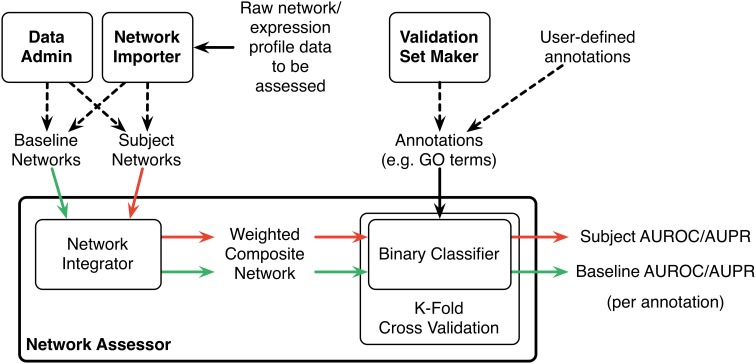
Figure 1.
Schematic diagram of the Network Assessor workflow. The green arrows indicate the first round of cross validation. Red arrows are second round. AUROC/AUPR statistics are computed for each node label (e.g., GO term) for each round of cross validation. Dashed lines indicate alternative options.

