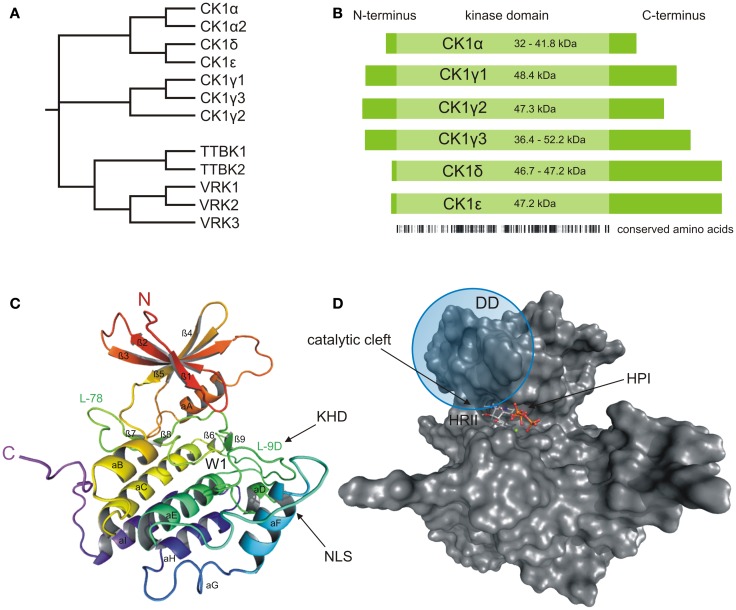
Figure 1.
Structural presentation of CK1δ. (A) Phylogenetic relation between CK1 isoforms of Homo sapiens (CK1α, γ1–3, δ, and ε) and other members of the human CK1 family (TTBK1–2, VRK1–3). (B) Schematic alignment of human CK1 isoforms α, γ1–3, δ, and ε. Their molecular weight varies between 32 (CK1α) and 52.2 kDa (CK1γ3). In case transcription variants have been reported for one isoform, the molecular weight is given as range from the smallest to the largest variant. All CK1 isoforms are highly conserved within their kinase domains (light green box, 286 aa), but differ within their variable N- (4–40 aa) and C-terminal (39–122 aa) non-catalytic domains (dark green boxes) [according to Knippschild et al. (333)]. Ribbon (C) and surface (D) diagram of the molecular structure of CK1δ (PDB code 4HGT) modeled in complex with Mg2+-ATP at a resolution of 1.80 Å. The nomenclature is adapted from Xu et al. (24) and Longenecker et al. (25). Until today, crystal structures of human CK1 isoforms γ1 (PDB code 2CMW), γ2 (2C47), γ3 (2CHL, 2IZR, 2IZS, 2IZT, 2IZU, 4HGL, 4HGS, 4G16, 4G17), δ (4KB8, 4KBA, 4KBC, 4KBK, 4HNF, 3UYS, 3UYT, 3UZP), and ε (4HNI, 4HOK) are accessible as well. For reasons of clarity, we focused on CK1δ exemplarily, due to its superior relevance. The catalytic domain folds into two lobes primarily containing strands (N-terminal), respectively helices (C-terminal) forming a catalytic cleft between that represents the ATP binding pocket as well as a substrate binding site. KHD indicates the kinesin homology domain within L-9D. DD refers to a putative dimerization domain containing various amino acids of β1, β2, β5, L-5B, β7, and αB, whereas NLS displays a putative nuclear localization signal sequence at the junction between L-EF and αF. A tungstate molecule binding site identifies a specific phosphate moiety binding motif (W1). The active site contains a deep hydrophobic pocket (HPI) and a spacious hydrophobic region (HRII) (25–28). All modeling and docking studies were performed using Schrödinger software (Maestro, version 9.3, Schrödinger, LLC, New York, NY, 2012; Glide, version 5.8, Schrödinger, LLC, New York, NY, 2012). The illustration of modeling results was generated by the PyMOL Molecular Graphics System (Version 1.5.0.4, LLC) (29).

