
Figure 6.
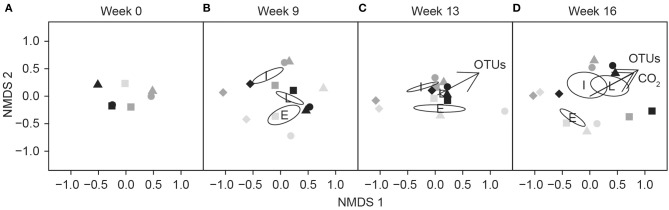
Non-metric multidimensional scaling (NMDS) ordination showing the separation of fungal communities at the beginning (A), after 9 weeks (B), 13 weeks (C), and 16 weeks (D) in the different dilutions or controls (autoclaved sawdust) according to the decay stage of substrate. Symbols represent the dilution of the fungal community: undiluted (squares), dilution 10−1 g inoculum/g substrate (circles), dilution 10−2 g inoculum/g substrate (triangles) and controls (diamonds). The intensity of the symbol indicates the decay stage. Vectors indicate the direction of maximum correlation of CO2 production and number of OTUs with ordinated samples (p < 0.01). Ellipses indicate the mean location of each decay stage: E, early; I, intermediate; and L, late.