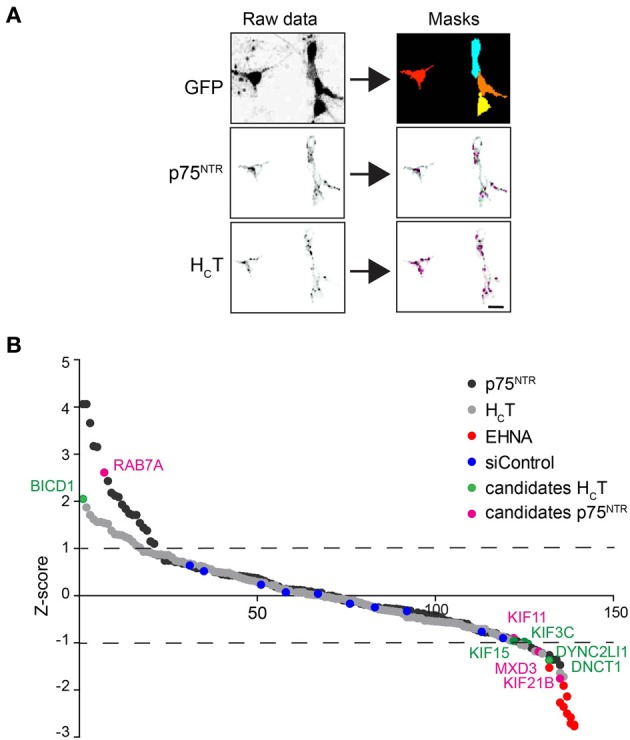
Figure 2.

Summary of the siRNA screen. (A) Image analysis pipeline used for the siRNA screen. Representative images of GFP-positive motor neurons used to create image masks (top right panels), from which images of internalized HCT and p75NTR were quantified. Scale bar, 10 μm. (B) Sigma plot of the Z-scores obtained for internalized HCT (gray circles) and p75NTR (black circles) for the entire siRNA library (see Table S1). Candidates that produced statistically significant increased (Z-score: >1) or decreased (Z-score: <1) accumulation phenotypes are shown in green (HCT) or violet (p75NTR). EHNA-treated positive controls are shown in red.
