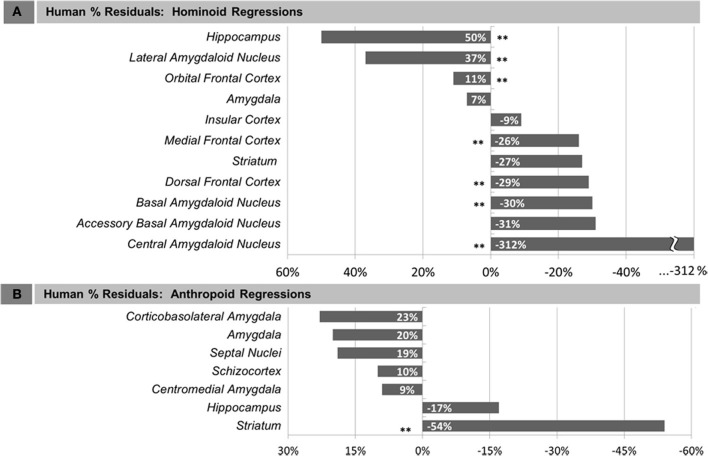
Figure 3.
Human percent residual deviations from non-human regression lines for: (A) Human comparisons with other hominoids and (B) human comparisons with other anthropoids. Asterisks (**) indicate residuals that were significant, determined either by 95% prediction intervals (subcortical structures) or comparison of means at p < 0.05 (cortical structures).

