
Figure 6.
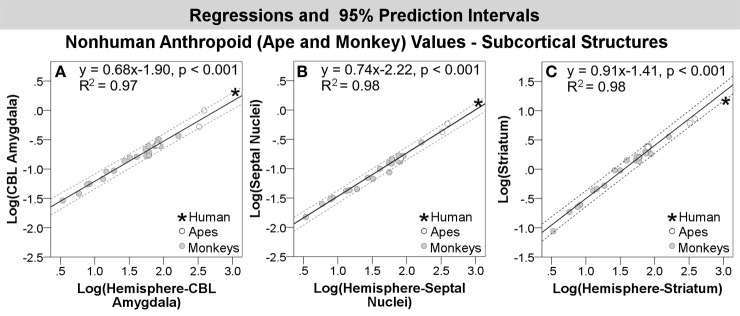
Log-log regressions and 95% prediction intervals (dashed lines) of species average volumes (cc) for select structures in the anthropoid dataset, which reached significance or fell in the upper bounds of the prediction interval, including: (A) corticobasolateral amygdala, (B) septal nuclei, and (C) striatum. Abbr: CBL, corticobasolateral amygdala.