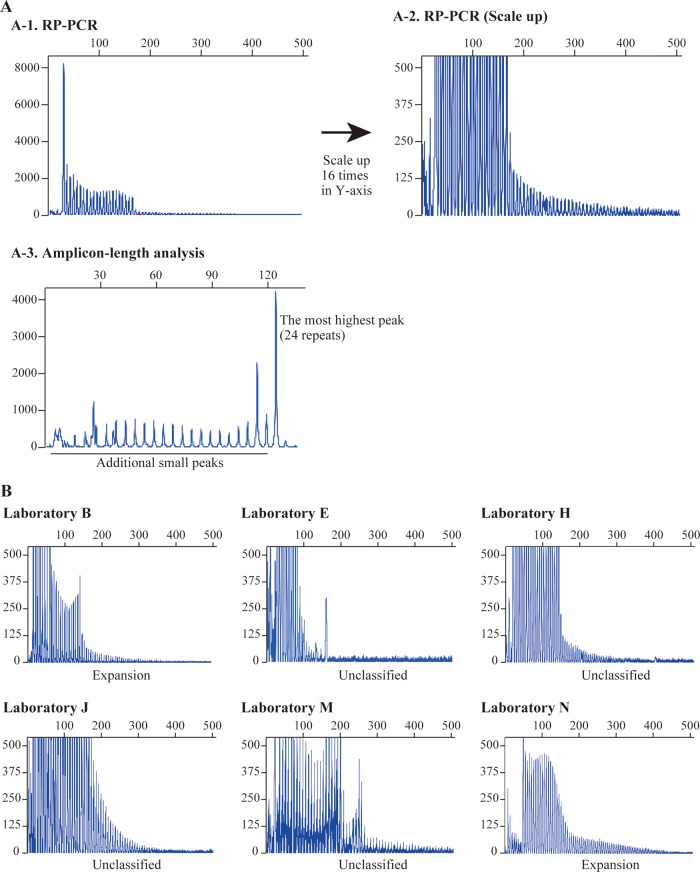
Figure 1.
Results from RP-PCR and amplicon-length analysis of sample 6.5. (A) A-1 is the full shape of RP-PCR and A-2 is a 16-times scale-up (Y-axis) shape of A-1. It is possible to see the clear saw-tooth pattern after scale-up. A-3 is the result of amplicon-length analysis and there is a number of small peaks before the highest last peak. It may be hard to identify the amplicon numbers because of these small peaks. (B) The RP-PCR figures and classifications of the same sample in different laboratories. The scale of the Y-axis is the same as in A-2.

