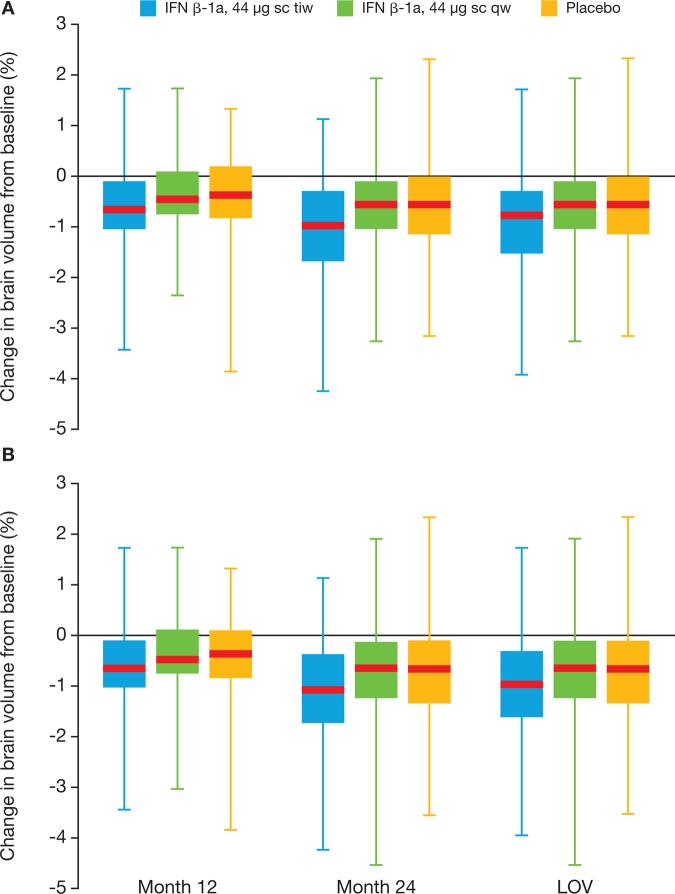
Figure 2.
Percentage change in brain volume from baseline, by visit (intent-to-treat population), during the (A) double blind period and (B) whole study period. Red lines represent the median, boxes represent the IQR, and whiskers represent the range. IFN, interferon; LOV, last observed value; sc, subcutaneously; tiw, three times a week; qw, once a week.

