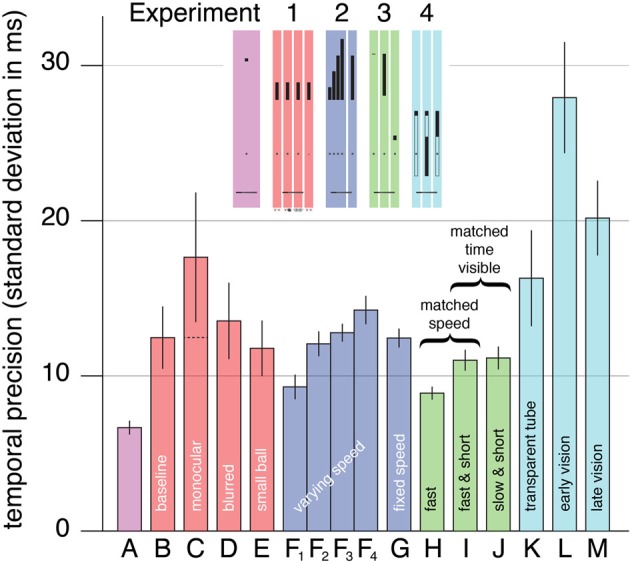
Figure 2.

Mean timing precision. Each experiment is represented by a different color. The letters indicate the conditions (for a quick graphical reference see the miniature version of Figure 1 that is included as an inset). The leftmost bar (A) shows the corresponding data from Brenner et al. (2012). There are four bars labeled F because there are four release heights in this condition. The dashed line in the bar for the monocular condition of Experiment 1 (bar C) indicates the precision that would be expected by combining two such monocular judgments (that are independent and equally precise). Error bars are standard errors across subjects.
