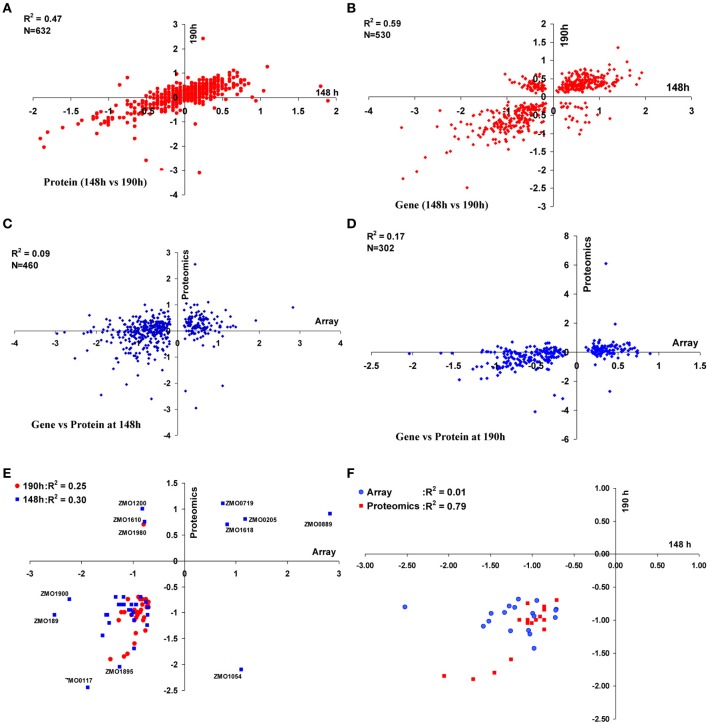
Figure 2.
Correlations between proteomic and transcriptomic data of ZM4 and AcR in MM. Correlation within proteomics or transcriptomics shared at time point of 148 and 190 h between 632 proteins (A) or 530 genes (B) differentially expressed between AcR and ZM4 (AcR/ZM4) in MM; and the correlation between proteomics or transcriptomics at different time points of 148 h (C) or 190 h (D) post-inoculation; as well as correlations between significant gene-protein pairs with at least 1.5-fold changes between transcriptomics and proteomics (E); and the correlation between common genes or proteins with at least 1.5-fold significant changes shared between the time point of 148 h and 190 h post-inoculation within transcriptomics or proteomics (F). Numbers of X-axis and Y-axis are log2-based values.

