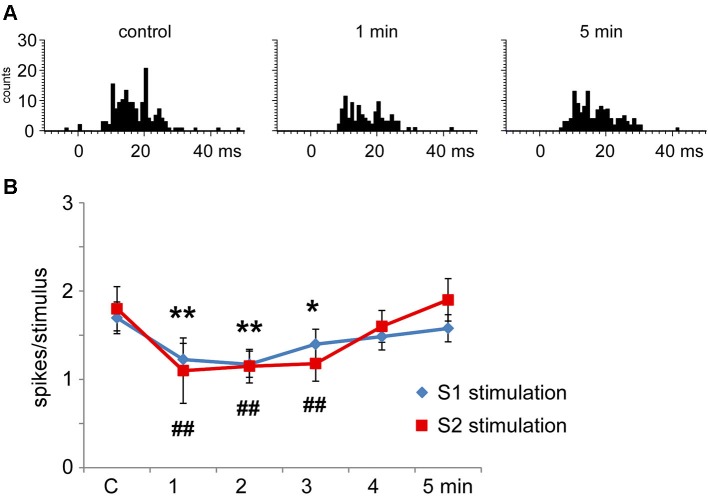
Figure 5.
Long-lasting S1 and S2 cortical effects on Pr5 neurons in unmatching conditions. (A) histograms show PSTHs in control condition, 1 min and 5 min after a stimulation train in a representative Pr5 neuron. (B) plot of the mean tactile responses in control condition and after S1 (blue diamonds) or S2 (red squares) cortical electrical stimulation (3 trains of stimuli; 50 Hz during 500 ms repeated every 2 s) in Pr5 neurons recorded in an unmatched condition (n = 35 and n = 9, respectively). Cortical stimulation inhibited tactile responses for 3 min. In this and in the following figures * P < 0.05, ** P < 0.01 statistical significance after S1 stimulation train with respect to control values; # P < 0.05, ## P < 0.01 after S2 stimulation train.

