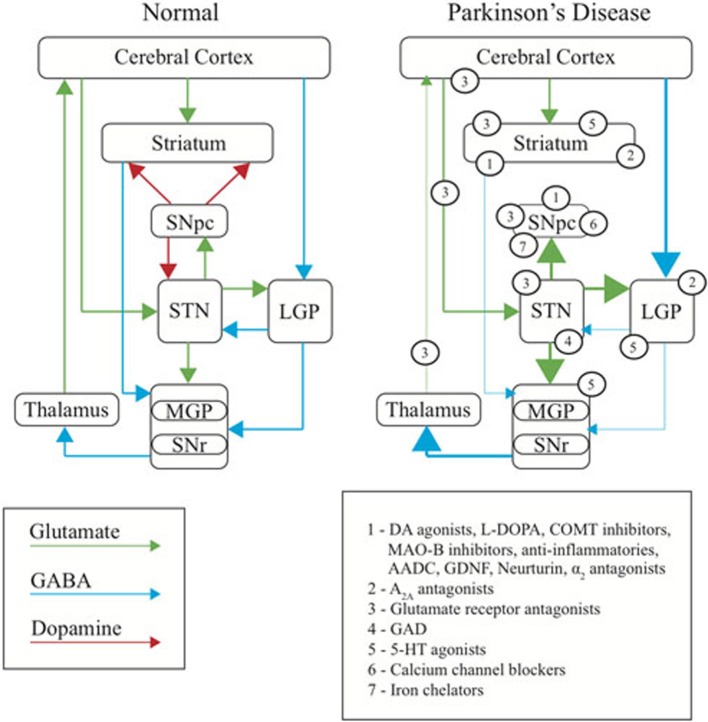
Figure 1.
Basal ganglia dysfunction in PD. Diagram representing the normal function of the basal ganglia (left), the changes occurring in PD (right), and the site of primary action of therapeutic targets discussed in this review (numbered). Arrows represent the major neurotransmitters of glutamate (green), GABA (blue) and dopamine (red). Relative thickness of the arrows indicates level of activity of neurotransmitter. SNpc, substantia nigra pars compacta; SNr, substantia nigra reticulata; STN, subthalamic nucleus; MGP, medial globus pallidus; LGP, lateral globus pallidus.

