
Figure 3.
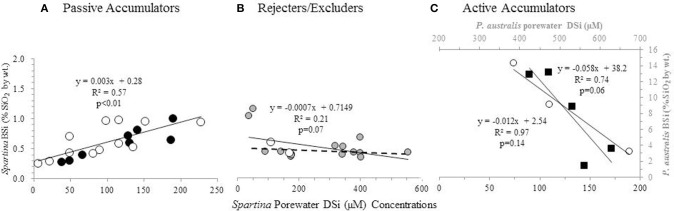
BSi concentration in aboveground biomass as a function of porewater DSi concentrations. S. patens (black circles), S. anglica (filled gray circles), and S. alterniflora (open white circles), P. australis (black squares). Dashed line in (B) indicates the regression ignoring the two S. anglica outliers. Values in (A,C) represent average values from triplicate field measurements in top 20 cm of sediment, with spring and summer values plotted individually. Values in (A) represent values from five New England salt marshes. Values in (B) represent ten marshes in Oosterschelde, and the two marshes in Bay of Brest (Querné et al., 2012). Values in (C) represent values from one marsh in New England (S. alterniflora data) and one marsh in Belgium [P. australis data from Struyf et al. (2005b)].