
Figure 5.
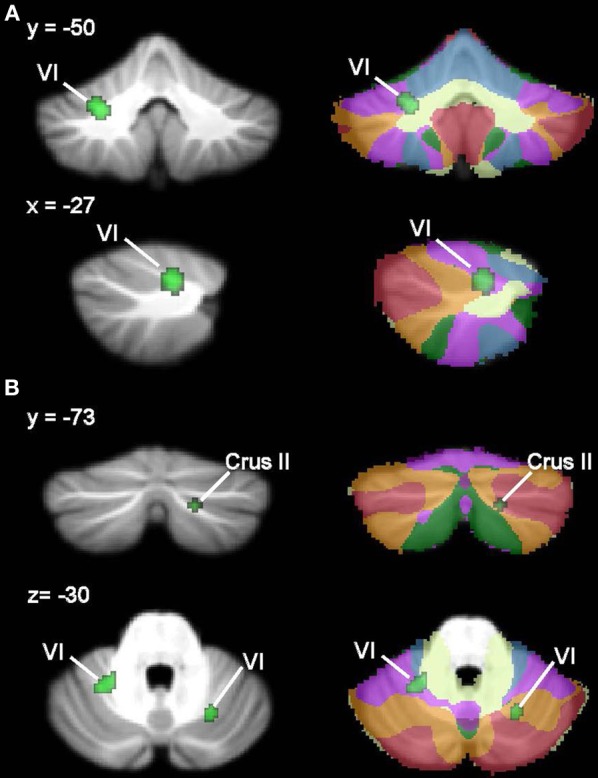
Dyslexia < TD GM: whole-brain and ROI analyses. Left (A), Regions in the whole-brain analysis showing significant ALE voxels where Dyslexia < TD (green), thresholded at p < 0.001, k > 50. (B) Regions showing Dyslexia < TD in the ROI analysis. Right, corresponding slices showing functional connectivity maps of the cerebellum (Buckner et al., 2011). Networks are color-coded such that blue, somatomotor; green, dorsal attention; violet, ventral attention; cream, limbic; orange, frontoparietal; red, default network.