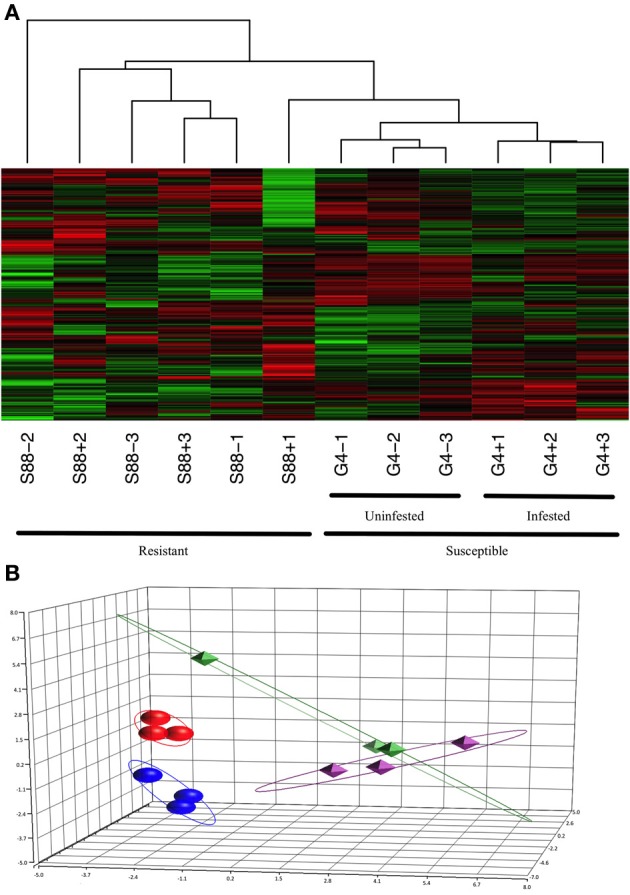
Figure 4.

Clustering of the kinome profiles of dark-eyed pupae of different phenotypes and infestation statuses. (A) Hierarchical clustering of kinome datasets. (1−Pearson correlation) was used as the distance metric, while McQuitty linkage was used as the linkage method. Each column represents the kinome activity of individual pupae (n = 3/treatment). For the most part, cluster analysis first segregated kinome profiles by colony phenotype (S88: resistant; G4: susceptible), and then segregated G4 pupae by presence or absence of Varroa infestation. (B) Principal component analysis. The first three principal components are shown. Separation of the samples on the basis of phenotype is clearly observed, with further distinction within the susceptible, but not resistant, samples on the basis of infestation status. The points are as follows: red, G4+; dark blue, G4−; green, S88+; purple, S88−. The proportions of variance explained by the first, second, and third principal components were 22.5%, 14.8%, and 11.2%, respectively.
