
Figure 1.
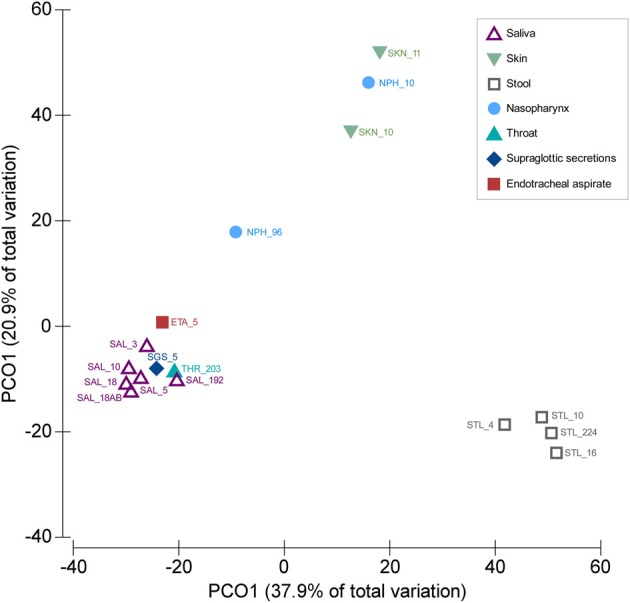
Similarities between SGS, ETA, and bacterial communities from other body parts. PCoA was based on Bray–Curtis similarity matrix constructed using square-root transformed average relative abundance of genera. The number following underscore corresponds to the number of subjects analyzed. Saliva samples: SAL_192 (Segata et al., 2012), SAL_10 (Ling et al., 2013), SAL_18 (from children, before antibiotic treatment) (Lazarevic et al., 2013b), SAL_18AB (from children, at the end of the antibiotic treatment) (Lazarevic et al., 2013b), SAL_5 (three time points for each subject) (Lazarevic et al., 2010), SAL_3 (Zaura et al., 2009). Throat swab: THR_203 (Segata et al., 2012); Supraglottic secretions: SGS_5 (five time points for each subject, this study); Endotracheal aspirate: ETA_5 (five time points for each subject, this study). Skin samples: SKN_10 (Ling et al., 2013), SKN_11 (MG-RAST ID 6526); Nasopharyngeal swabs: NPH_96 (Bogaert et al., 2011), NPH_10 (Ling et al., 2013). Stool samples: STL_224 (Segata et al., 2012), STL_10 (Ling et al., 2013), STL_16 (five time points for each subject) (Krych et al., 2013), STL_4 (data designated V4-0.5) (Claesson et al., 2009). The abundance of genera were taken directly from the tables provided in corresponding publications, except for the SKN_11 (unpublished) for which the MG-RAST data were processed using the bioinformatics pipeline as described in this paper.