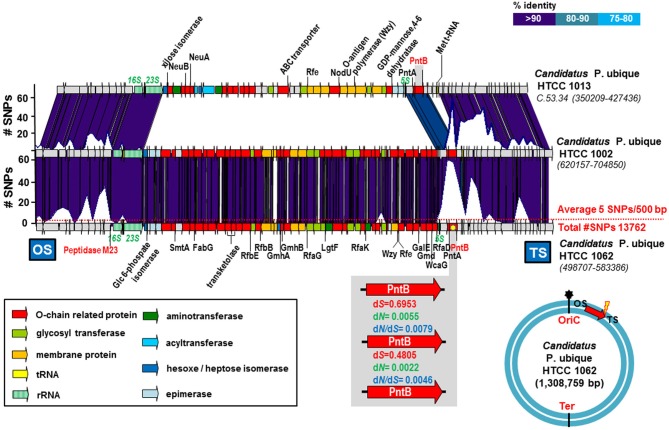
Figure 1.
Candidatus Pelagibacter ubique HTCC 1013, 1002, and 1062 O-chain cluster. The plot above the genomes indicates the number of SNPs in a 500 bp window. The average number of SNPs in the genome is indicated by a red dot line. The region enlarged in the gray box indicates the rate of non-synonymous (dN), synonymous (dS) substitutions and the dN/dS ratios for the gene which accumulates the largest number of SNPs that encodes a PntB: beta subunit of the NAD (P) transhydrogenase (marked with a yellow asterisk). The blue circle indicates the position of the gene cluster in the Candidatus Pelagibacter ubique HTCC1062 genome. The origin of replication (oriC) has been manually identified, while the terminus (Ter) is just located oposite (not identified). The red arrow shows the orientation in which the gene cluster is represented. Yellow lightning indicates the side of the island where the accumulation of SNPs is highest. OS, Origin Side; TS, Terminus Side.

