. 2014 May 27;3:e02200. doi: 10.7554/eLife.02200

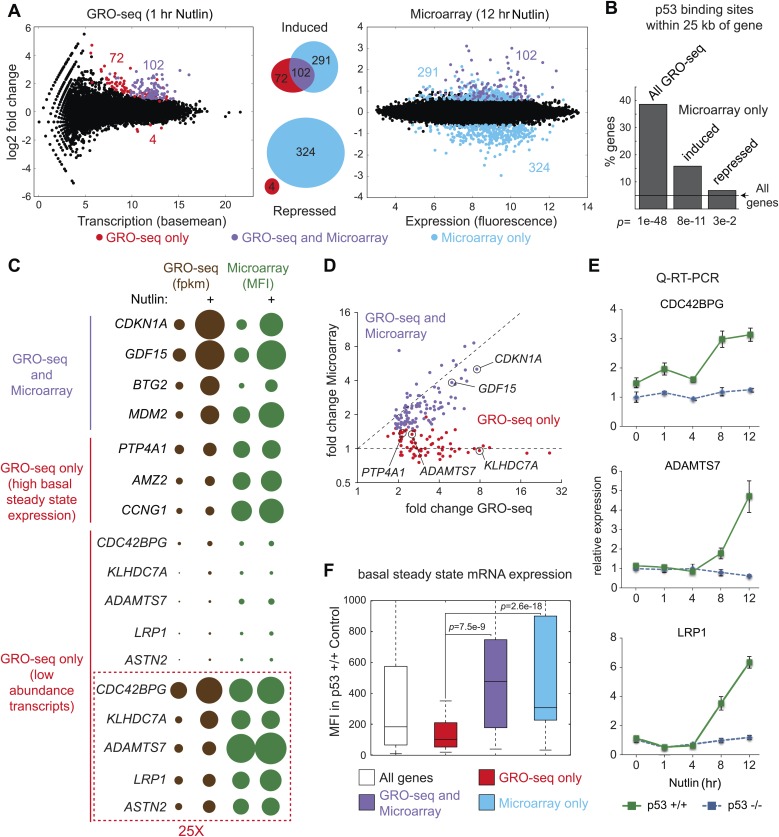
Figure 2. Global analysis of p53 effects on RNA synthesis vs steady state levels.

(A) MAplots for GRO-seq and microarray gene profiling experiments in HCT116 p53 +/+ cells after 1 hr and 12 hr of Nutlin treatment, respectively. Colors indicate whether genes scored as statistically different in both platforms (purple), in the GRO-seq only (red) or the microarray experiment only (blue). (B) Few genes downregulated in the microarray experiment show p53 binding within 25 kb of the gene, suggestive of indirect regulation. (C) Bubble plots displaying relative signals derived from the GRO-seq and microarray experiments illustrate how genes with very high basal expression or very low transcription are not significantly affected at the steady state level as measured by microarray. For the CDC42BPG, KLHDC7A, ADAMTS7, LRP1 and ASTN2 loci, the signals were replotted at 25-fold magnification. (D) Scatter plot showing comparative fold induction for p53 target genes transactivated at 1 hr Nutlin treatment between the GRO-seq and microarray experiments. (E) Q-RT-PCR indicates that many low abundance transcripts upregulated by GRO-seq are indeed induced at the steady state level. (F) Box and whisker plots showing the expression of various gene sets as detected by microarray.

DOI: http://dx.doi.org/10.7554/eLife.02200.005

Figure 2.

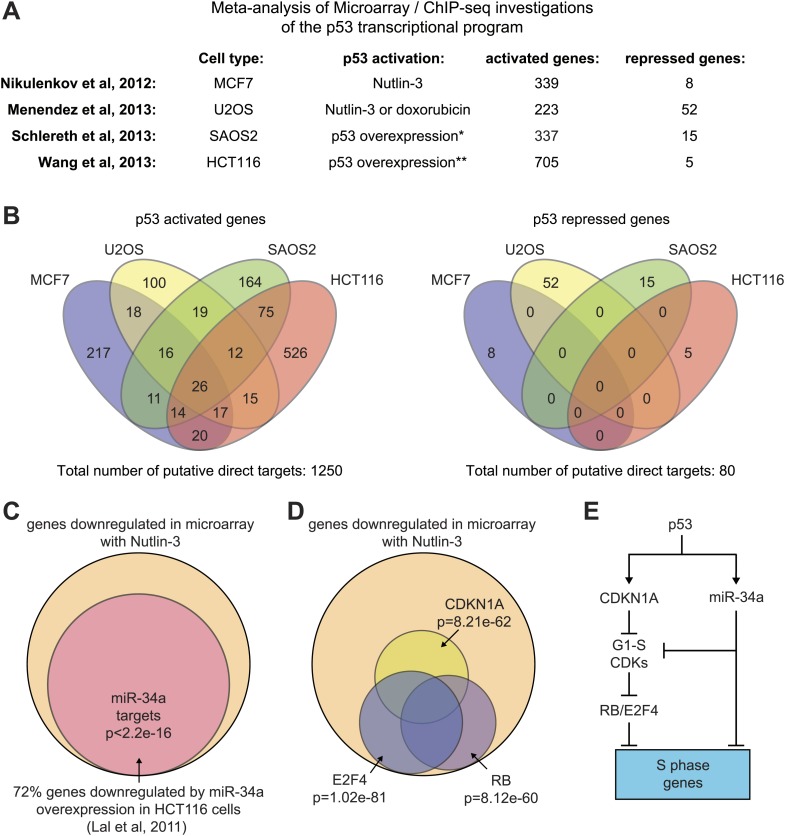
Figure 2—figure supplement 1. Mechanisms of indirect gene repression by p53.

Figure 2—figure supplement 1.

(A and B) Meta-analysis of four recent investigations of the p53 transcriptional program using microarray analysis of RNA steady state levels and ChIP-seq measurements of p53 binding reveals little overlap between the experiments. See Supplementary file 2 for the various gene lists used to generate the Venn diagrams using Venny (http://bioinfogp.cnb.csic.es/tools/venny/). *This study employed SAOS2 cells, which are p53 null, with overexpression of various p53 isoforms. ** This study employed HCT116 p53 −/− cells with overexpression of natural p53 polymorphic variants. (C) 72% of genes downregulated upon 12 hr of Nutlin treatment in HCT116 cells were found to be repressed in this same cell type by overexpression of miR-34a, a p53 inducible miRNA. (D) Ingenuity Pathway Analysis of genes downregulated upon 12 hr Nutlin treatment indicates that the top three regulators of this gene set are E2F4, CDKN1A and RB. (E) Model of indirect gene repression by p53 via upregulation of CDKN1A and miR-34a, both of which inhibited G1-S CDK complexes.
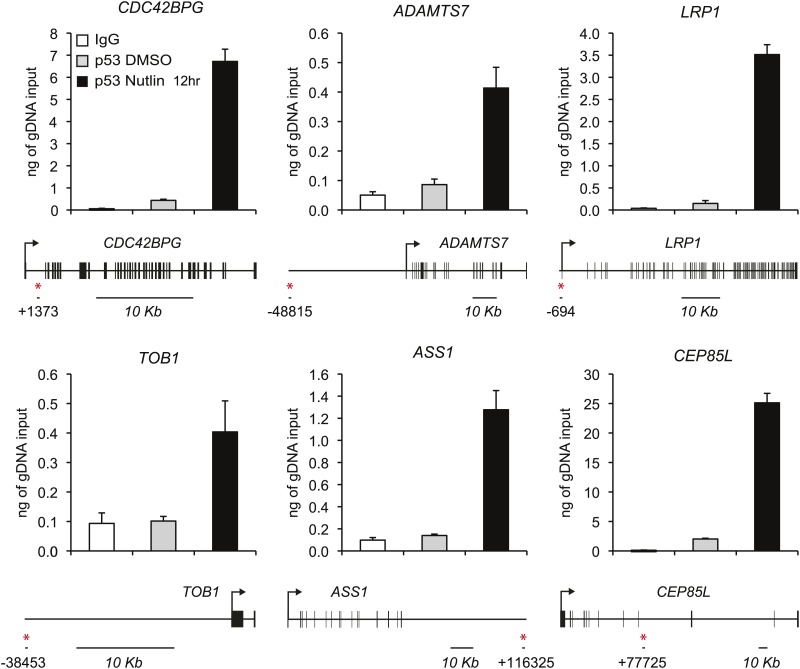
Figure 2—figure supplement 2. ChIP analysis of novel p53 target genes.

Figure 2—figure supplement 2.

Analysis of p53 ChIP-seq datasets indicated high confidence p53 binding events in the vicinity of novel p53 target genes identified by GRO-seq at the genomic positions labeled with a red asterisk. ChIP-Q-PCR assays in HCT116 p53 +/+ cells confirm p53 binding at these locations above background levels (IgG control).