. 2014 May 27;3:e02200. doi: 10.7554/eLife.02200

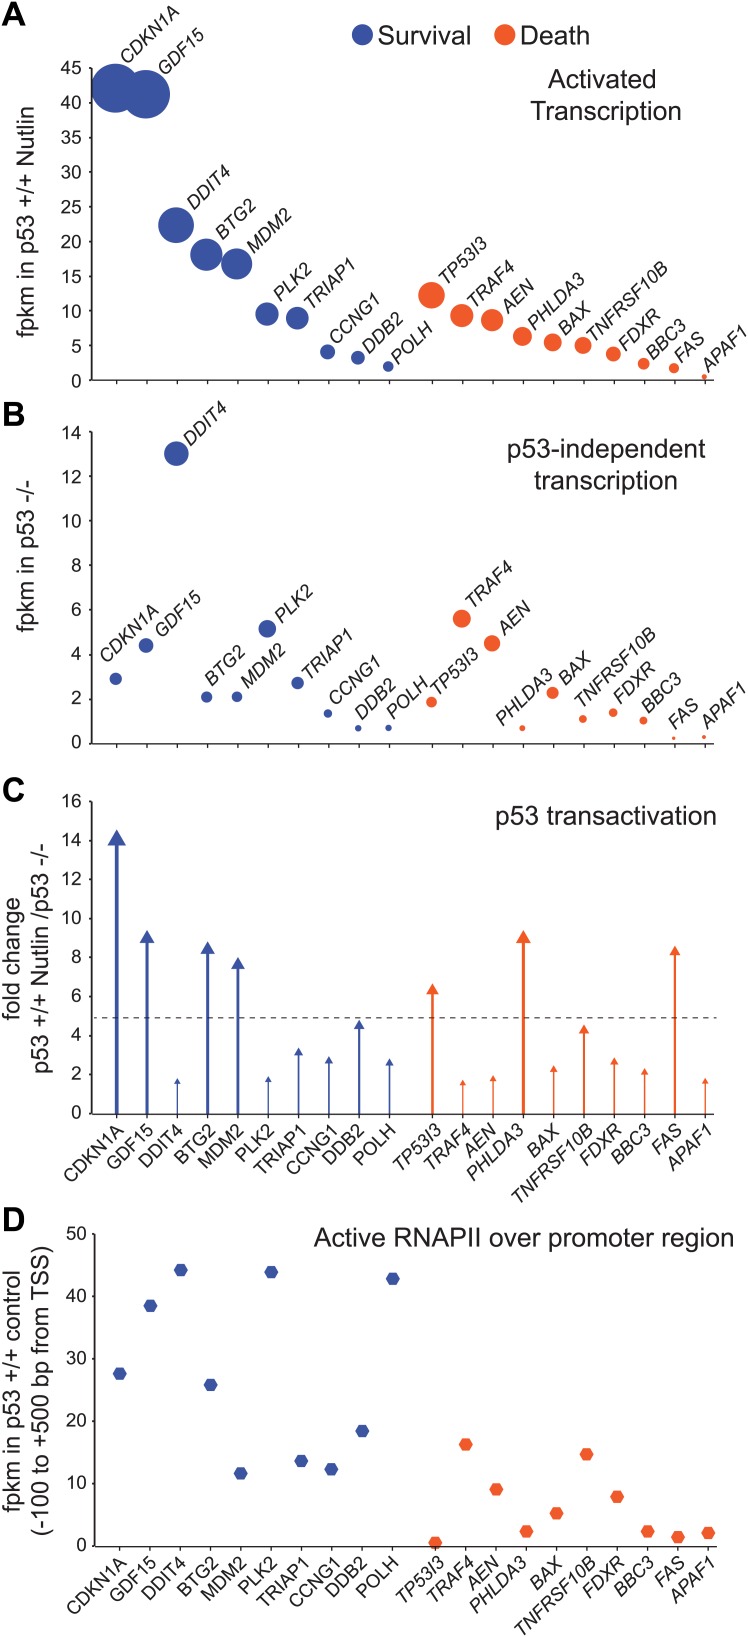
Figure 4. GRO-seq analysis of key survival and death genes within the p53 network.

(A) The 10 most transcribed pro-survival and pro-apoptotic genes identified by GRO-seq ranked by decreasing transcriptional output in Nutlin-treated p53 +/+ cells. The surface of the bubbles represents the GRO-seq signal output relative to the CDKN1A locus. (B) Transcriptional output of same genes shown in A in p53 −/− cells. (C) Fold change analysis showing the overall effect of p53 on the transcription of its survival and apoptotic targets. (D) Survival genes within the p53 network tend to carry more proximally bound, transcriptionally engaged RNAPII over their promoter regions than apoptotic genes.

DOI: http://dx.doi.org/10.7554/eLife.02200.011

Figure 4.

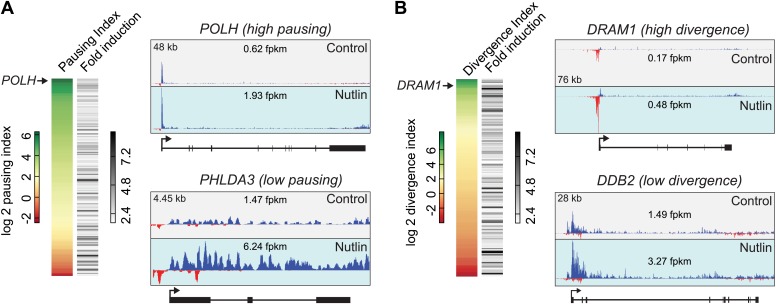
Figure 4—figure supplement 1. p53 target genes display a wide range of RNAPII pausing and promoter divergence.

Figure 4—figure supplement 1.

(A) RNAPII pausing is not a pre-requisite for rapid activation among p53 target genes. A ranking of pausing indices show no correlation with fold induction among p53 targets. POLH and PHLDA3 are representative examples of genes with high and low pausing indices. (B) p53 target genes show a great variation in the amount of promoter divergence, but a ranking of divergence indices shows no correlation with fold induction. DRAM1 and DDB2 are examples of p53 targets with high and low divergence, respectively.
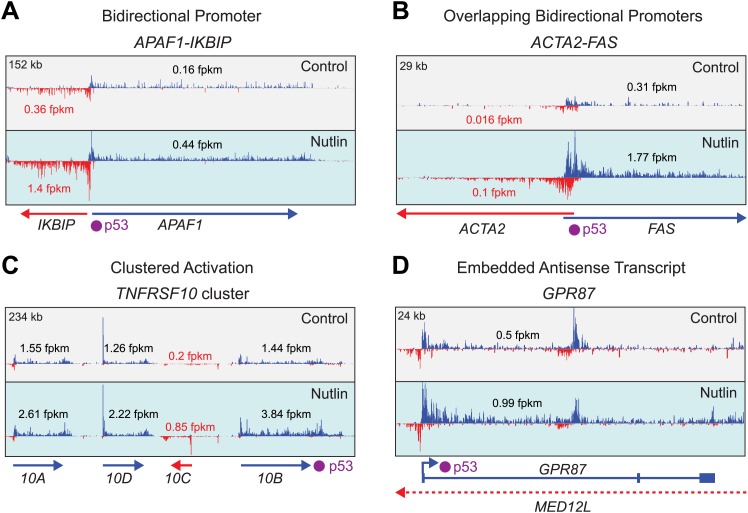
Figure 4—figure supplement 2. Examples of gene-specific features affecting key pro-apoptotic and survival p53 target genes.

Figure 4—figure supplement 2.

See main text for details.