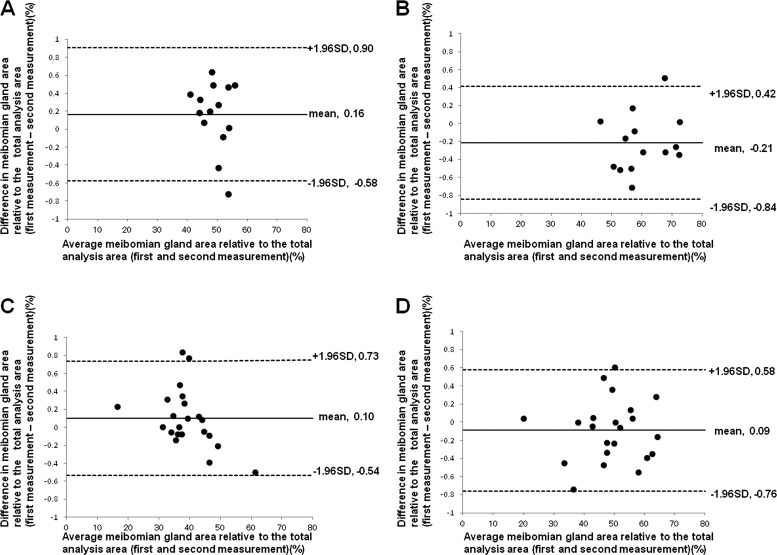
Figure 11.
Bland–Altman plots for (A) upper eyelids of normal subjects, (B) lower eyelids of normal subjects, (C) upper eyelids of patients with Meibomian gland dysfunction (MGD) and (D) lower eyelids of patients with MGD. The 95% CI of the difference in meibomian gland area relative to the total analysis area in the normal upper eyelids, normal lower eyelids, upper eyelids of MGD patients and lower eyelids of MGD patients were −0.054 to 0.382, −0.397 to −0.027, −0.045 to 0.242 and −0.241 to 0.062, respectively. Negative fix bias was judged to exist only in the lower eyelids of normal subjects.

