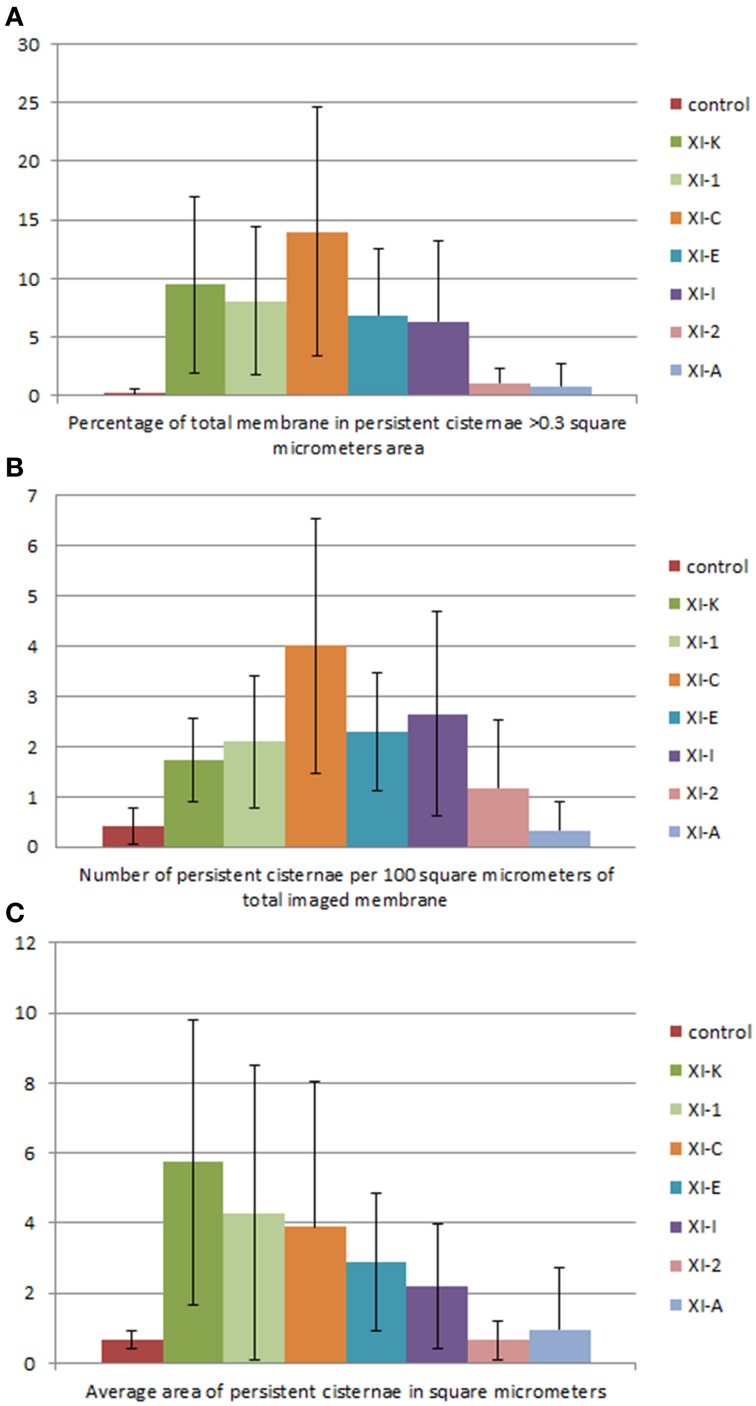
Figure 7.
Quantification of the effects of myosin tail domains on persistent ER cisternae. (A) Counts of the cumulative percentage area of highly persistent cisternae (see Figures 5, 6 for examples). (B) Counts of the number of persistent cisternae per hundred square micrometers of ER membrane analyzed for all of the myosin subclasses. (C) Average area of persistent cisternae in square micrometers. Error bars represent standard deviation. The level of significance of the difference between the samples is described in Table 1.

