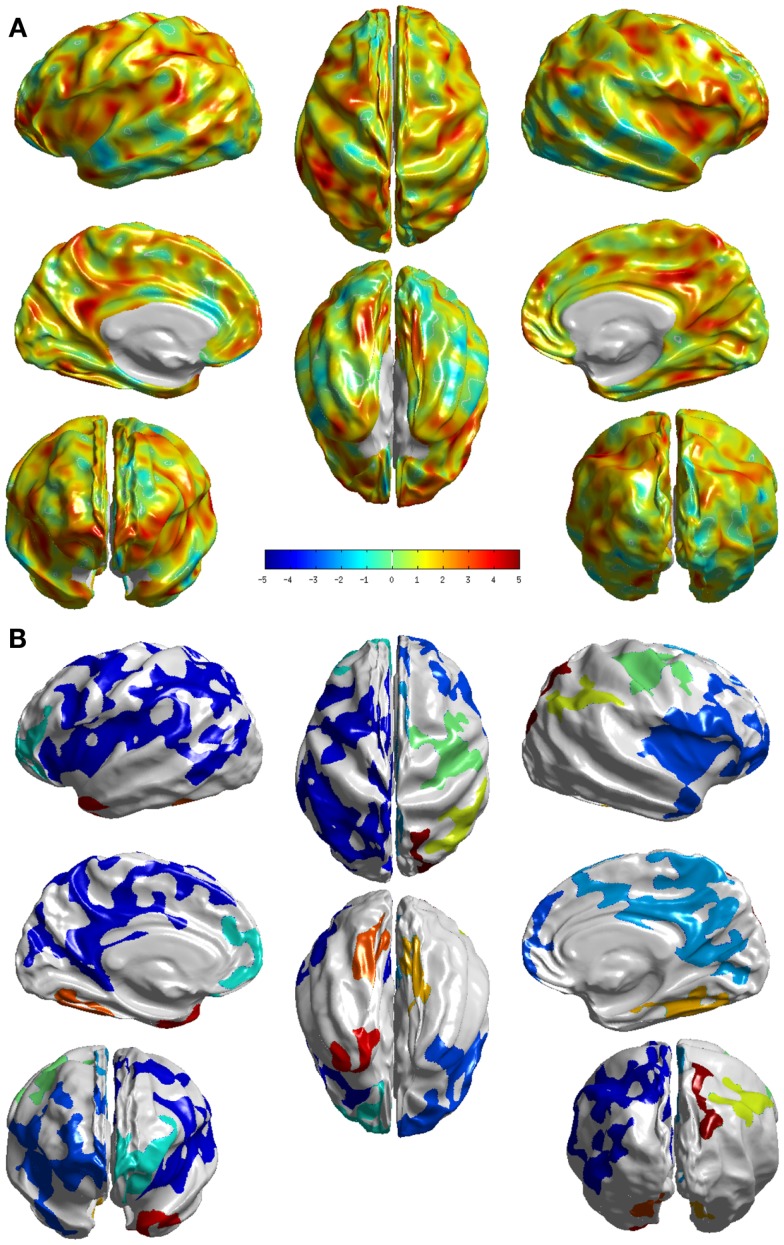
Figure 3.
Visualization of the differences between the two groups NC and md-aMCI. (A) T-statistic values displayed at each vertex (B) the set of clusters, which survived the multiple-comparisons test (cluster-wise significance), each colored differently. We can see that they exhibit significant differences, in many cortical areas compared to the differences noticed between NC and sd-aMCI as shown in Figure 2B.

