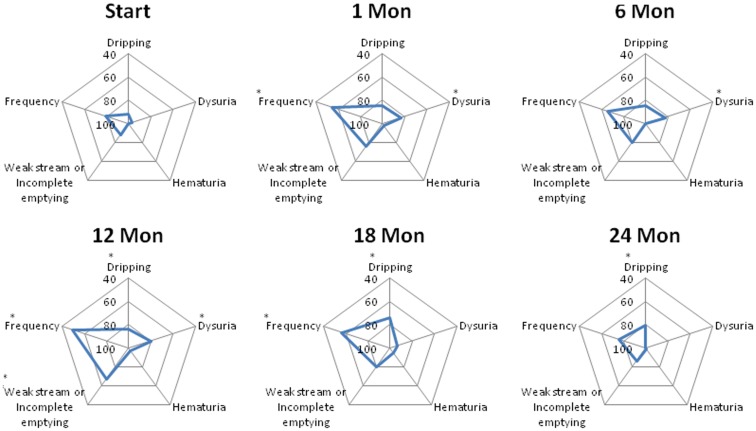
Figure 4.
Spider plots of individual EPIC urinary symptom scores at baseline and following SBRT for prostate cancer. Dripping-question 4A of the EPIC-26; dysuria-question 4B of the EPIC-26; hematuria-question 4C of the EPIC-26; weak stream or incomplete emptying-question 4D of the EPIC-26; and frequency-question 4E of the EPIC-26. EPIC scores range from 0 to 100 with higher values representing a more favorable health-related QOL. Changes in scores that are both statistically and clinically significant are marked with an asterisk (*).

