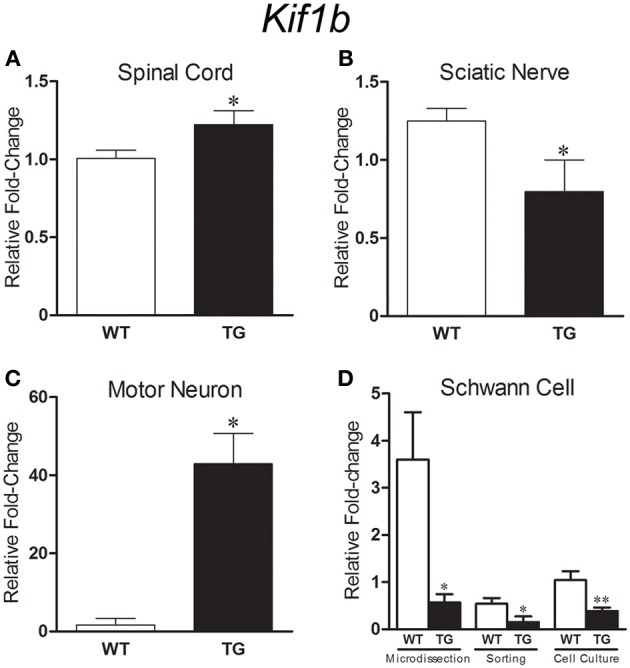
Figure 5.

Graphs show relative fold change values for Kif1b in SOD1G93A (TG) and age matched wild-type controls (WT) mice by means of qPCR. Gene expression differences in the spinal cord [40 days old, (A)], sciatic nerve [60 days old, (B)] and microdissected motor neurons [40 days old, (C)] are pointed. Kif1b expression was downregulated in sciatic nerve Schwann cell [60 days old, (D)] enriched samples from microdissection, flow cytometry sorting and cell culture procedures. Means ± SEM from four samples of each group. * and ** p-values, < 0.05 and < 0.01, respectively, according to unpaired t test.
