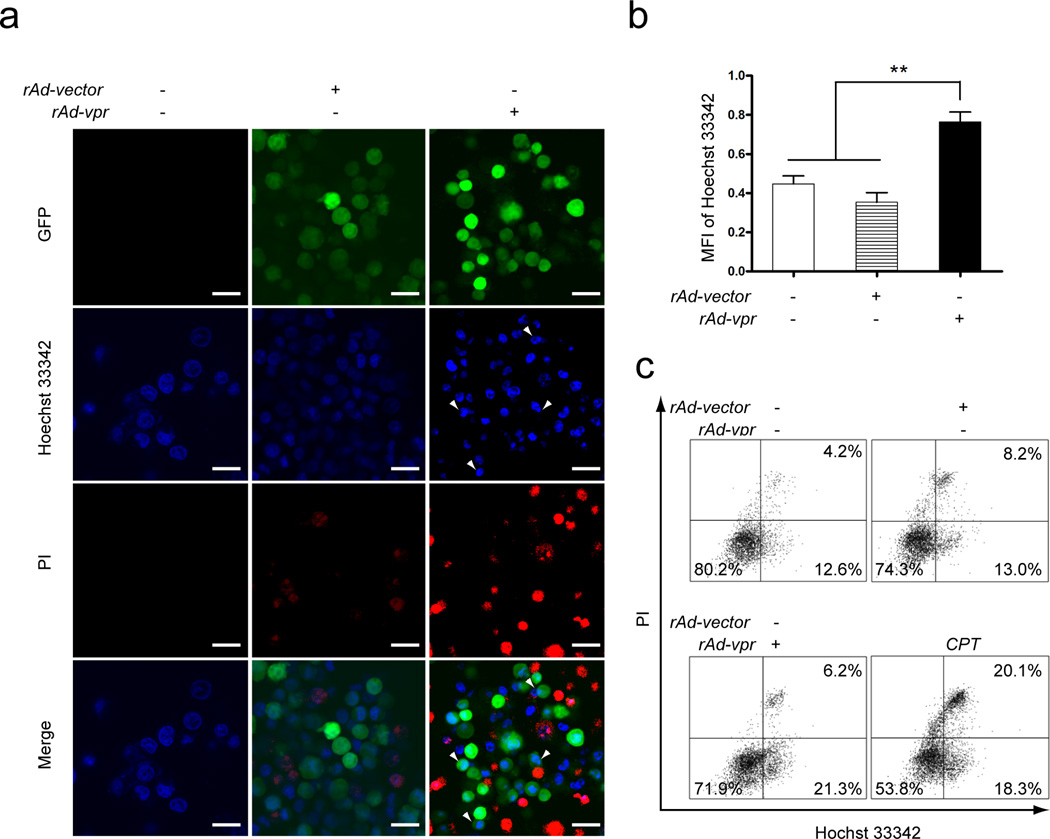
Fig. 3.
Apoptosis and plasma membrane integrity changes induced by endogenously expressed Vpr in C8166 cells. Mock-, rAd-vector and rAd-vpr infected as well as CPT (0.5 µmol/l) treated cells were cultured for 24 h and subjected to Hoechst 33342 and PI double staining. a Observations of apoptotic bodies and plasma membrane integrity changes. Images shown are representative observations from 3 independent experiments. Green images indicate GFP positive cells, blue images show Hoechst 33342 fluorescence, and red images exhibit PI staining of nucleic acids. Arrow heads indicate condensed DNA and apoptotic bodies. Scale bar = 20 µm. b MFI quantification of Hoechst 33342 staining in mock-, rAd-vector and rAd-vpr infected groups. c FACS analysis of both Hoechst 33342 and PI staining. Data are shown as mean ± SEM. One-way-ANOVA analysis, n = 3. ** P<0.01.

