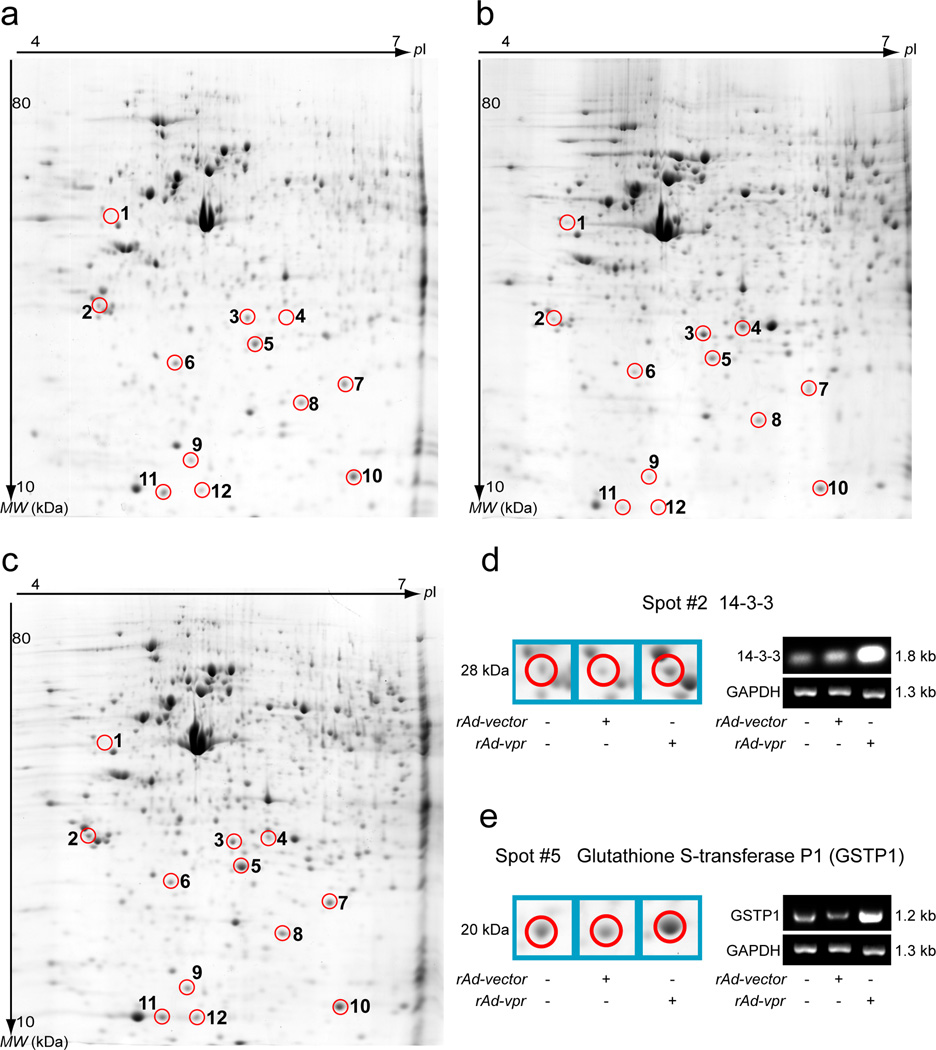
Fig. 4.
Two-dimensional electrophoresis analysis of endogenous Vpr induced C8166 cell death. Cells were cultured 48 h after mock or viral infection before lysing. Protein separation of cell lysates obtained by 2DE gels and images were acquired after post-staining with colloidal Coomassie Blue. After analysis and normalization by PDQuest software, images are shown for mock- (a), rAd-vector (b), and rAd-vpr (c) infected C8166 cells. Circled spots with identical spot numbers across gels indicate proteins at the same gel positions. The numbering is also consistent with Table 1, which provides protein identifications generated by mass spectrometry. RT-PCR was performed on the 14-3-3 (d) and GSTP1 (e) proteins, and sample loading was controlled by GAPDH mRNA quantification, respectively.

