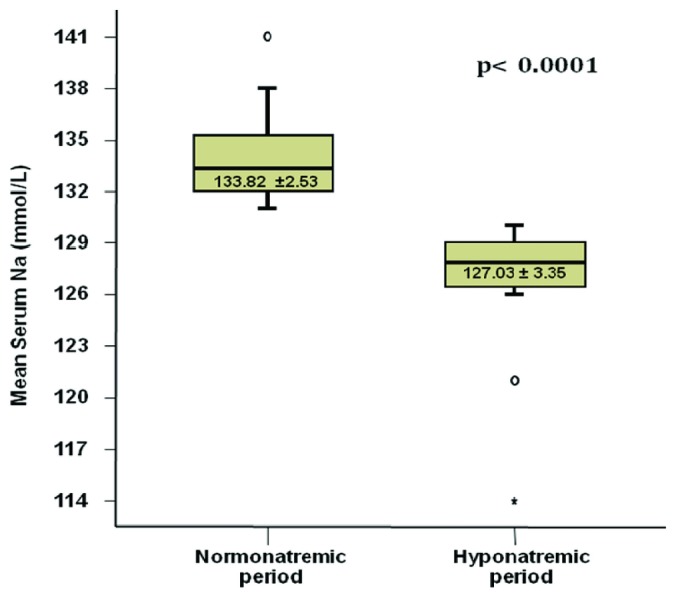
Figure 4 —

Box plot presenting the difference in mean serum sodium between the baseline “normonatremic” period and the subsequent hyponatremic period for the 24 patients who experienced hyponatremia. The whiskers in the plot represent the 95% confidence interval.
