Figure 2 —

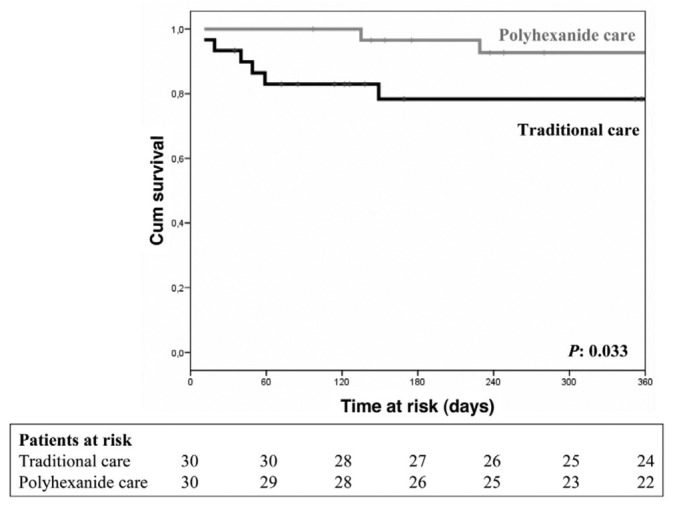
Period of time free of infection of the exit site. The black line represents patients who received the traditional treatment; the grey line represents patients who received the polyhexanide treatment (p=0.033; log rank: 4.2).

Period of time free of infection of the exit site. The black line represents patients who received the traditional treatment; the grey line represents patients who received the polyhexanide treatment (p=0.033; log rank: 4.2).