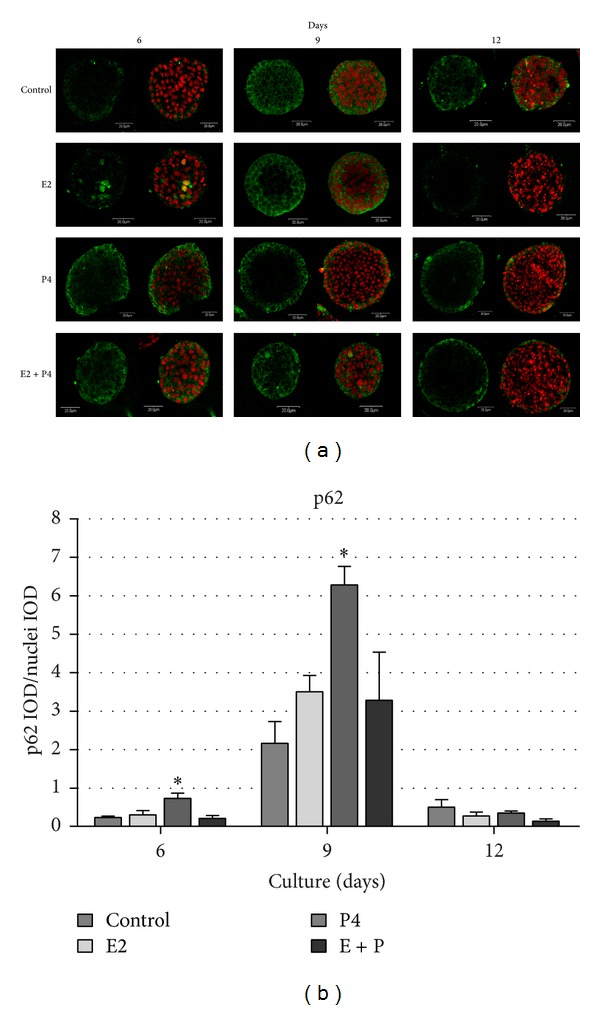
Figure 3.

Confocal images of acinar structures formed by BME-UV1 cells cultured on Matrigel for 6, 9, or 12 days in differentiation medium (control), enriched with 17β-estradiol (E2, 1 nM), progesterone (P4, 5 ng/mL), or both (E2 + P4); (a) panel of images presents immunofluorescence staining of p62 (green fluorescence): DNA was counterstained with 7AAD (red fluorescence); (b) graph representing quantitative analysis of the intensity of green fluorescence of p62 immunostaining, presented as the ratio of integrated optical density (IOD) of p62 to IOD of nuclei in each acinar structure analysed; *statistically significant difference (P < 0.05) in comparison with control conditions.
