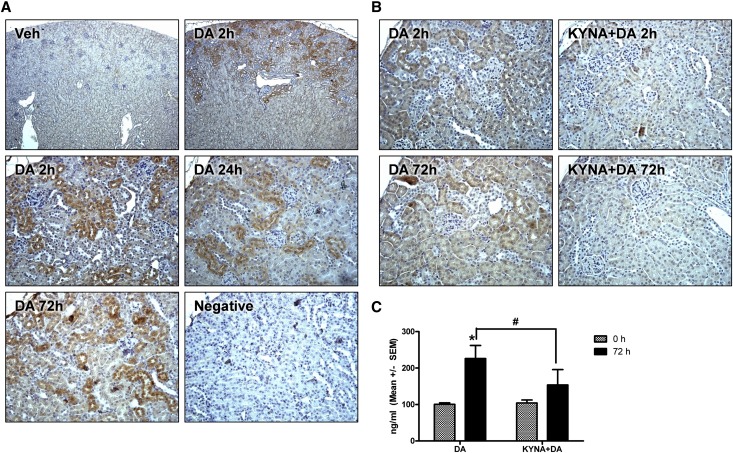
Figure 6.
Acute DA administration induced renal cortical NGAL expression. (A) NGAL IHC at 2, 24, or 72 hours after DA or vehicle treatment in the renal cortex as viewed in low- (top panels; 5× objective) or higher-powered images (bottom panels; 20× objective). Diaminobenzidine chromogen with hematoxylin counterstain was used. Veh, vehicle. (B) NGAL IHC at 2 or 72 hours after DA or KYNA+DA treatment (20× objective). (C) uNGAL excretion 72 hours after DA or KYNA+DA treatment. *Data were significantly different from the 0-hour time point. #KYNA+DA treatment was significantly different from DA (n=3, P<0.05, ANOVA followed by Newman–Keuls for individual group comparisons).

