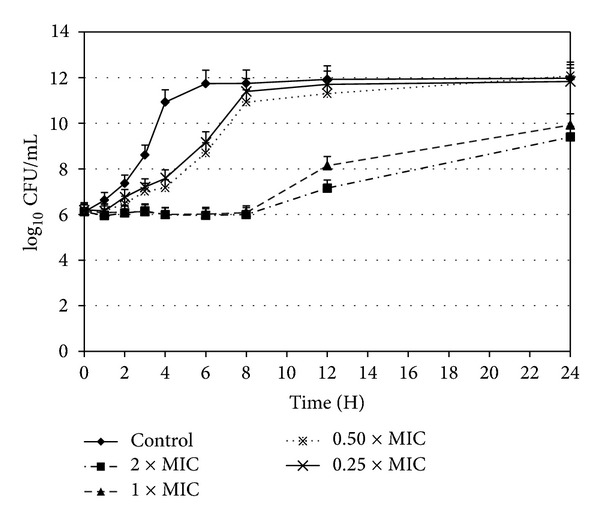
Figure 1.

Time-kill curves of S. typhimurium KCTC 2515 after treatment with EFNTE at 0.25 × MIC (※), 0.50 × MIC (×), 1 × MIC (▲), and 2 × MIC (■). Ca-MHB was used as a control (◆). The results are presented as mean ± standard deviations (n = 3), and the coefficients of variation for all concentrations are ≤5%.
