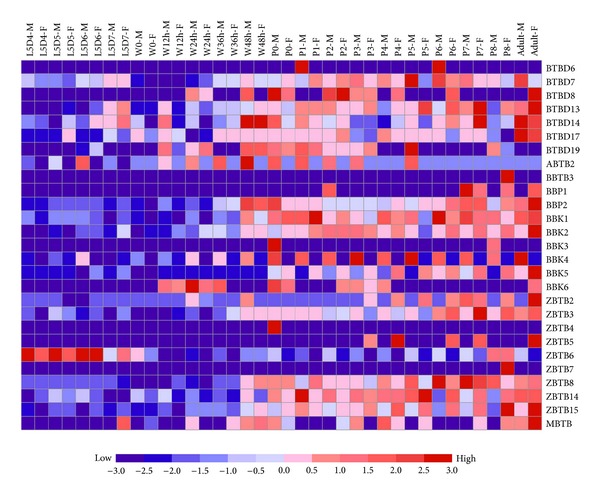
Figure 7.

Microarray-based expression profiling of the BTB protein genes during silkworm metamorphosis. Time-course microarray data representing gene expression during silkwormmetamorphosis was used to profile the developmental expression patterns of silkworm BTB protein genes. Changes in the expression of the BTB protein genes were visualized using the GeneCluster 2.0 program. Plus and minus denote up- and downregulation, respectively. F: female; M: male; L: larval; W: wandering; P: pupal; D: day; h: hour. The Arabic numeral in phase P1 represents one day after pupation.
