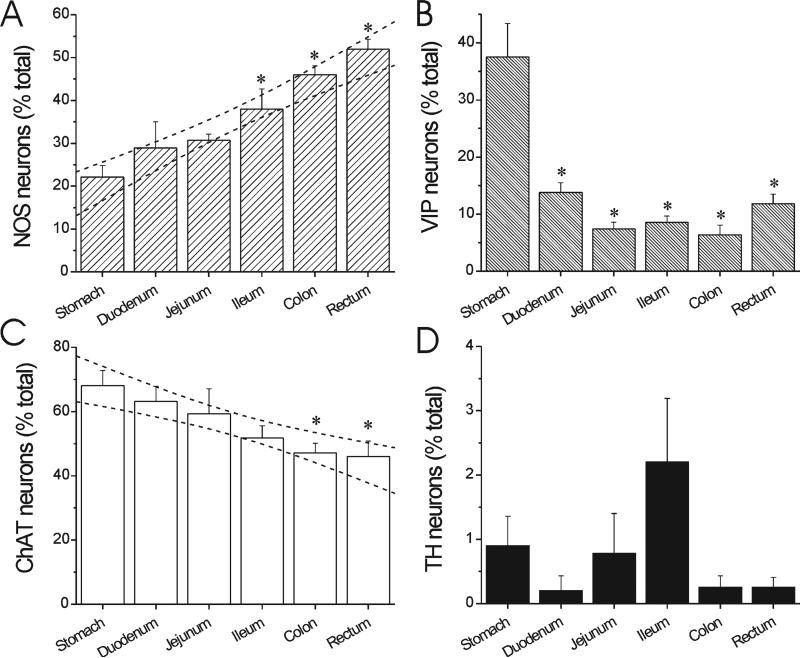
Figure 2.
Distribution of major neuronal subtypes in rhesus monkey myenteric plexus. A: NOS myenteric neuron distribution. B: VIP myenteric neuron distribution. C: Cholinergic (ChAT) myenteric neuron distribution. D: TH myenteric neuron distribution. Bars are mean ± SEM from five animals. The proportion of neuron subtypes varies based on GI tract segment. There is a progressive increase in abundance of NO neurons (R2 = 0.72, F = 70.3, P < 0.0001 for slope > 0) and a decrease in ChAT neurons (R2 0.44, F = 22.3, P < 0.0001 for slope < 0). Dashed lines represent 95% confidence bands for linear regression. *P < 0.05 vs. stomach, repeated measures ANOVA with post-hoc Bonferroni test.

