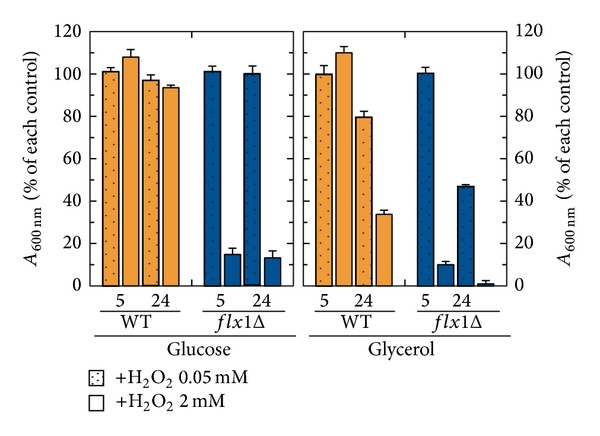
Figure 2.

Sensitivity to H2O2. WT and flX1Δ cells were cultured at 30°C in YEP liquid medium supplemented with either glucose or glycerol (2% each) as carbon source. Where indicated, H2O2 at the indicated concentration was added. Cell growth was estimated at the exponential (5 h) and stationary phase (24 h) by measuring the absorbance at 600 nm (A 600 nm). In the histogram, the A 600 nm of the cell cultures grown in the presence of H2O2 is reported as a percentage of the control (i.e., the A 600 nm of cell cultures grown in the absence of H2O2, set arbitrary equal to 100%). The values reported in the histogram are the means (±SD) of three experiments.
