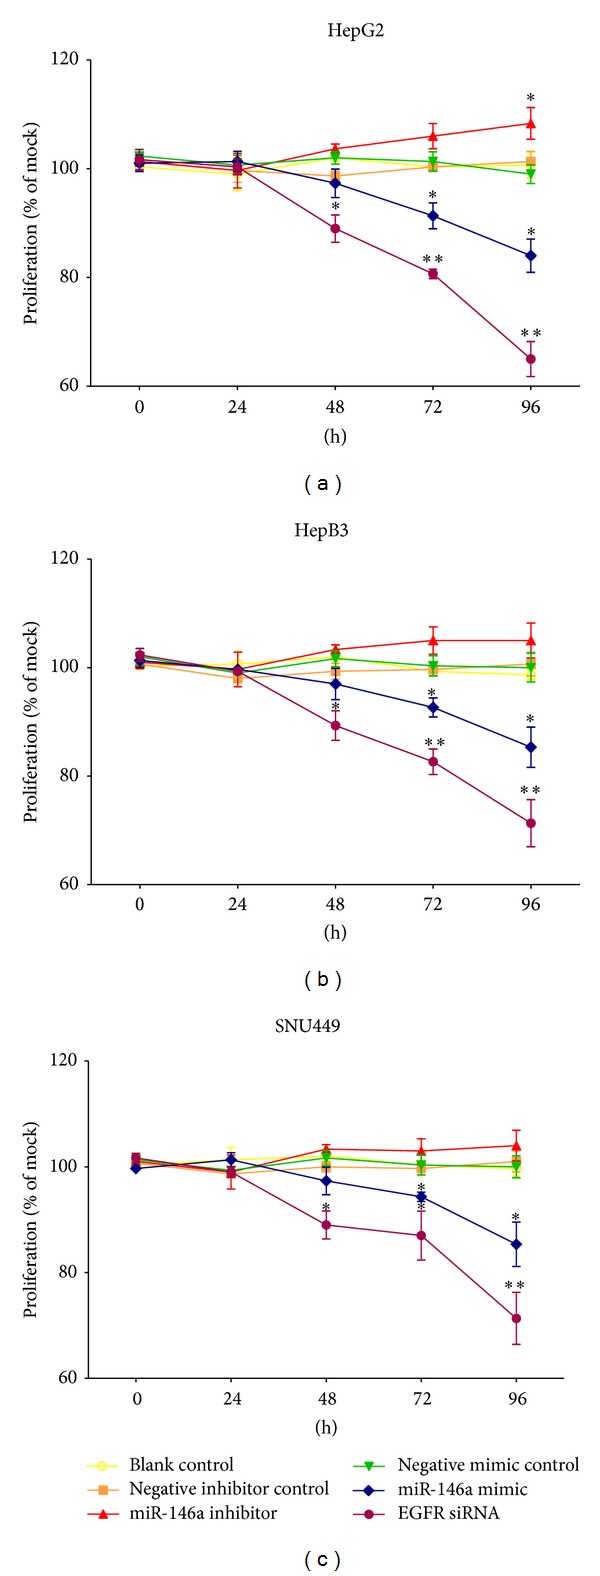
Figure 2.

Time dependent effect of miR-146a on cell proliferation in HCC cell lines. HepG2, HepB3, and SNU449 cells (2.5 × 10³ cells per well in 96-well plate) were cultured for 24 h and then transfected with miR-146a inhibitor, miR-146a mimic, EGFR siRNA, and their negative controls (200 nM) up to another 96 h. Cell proliferation was assessed per day with MTS assay (CellTiter 96 Aqueous One Solution Cell Proliferation Assay). *P < 0.05, **P < 0.01, compared to blank and negative controls at the same time point.
