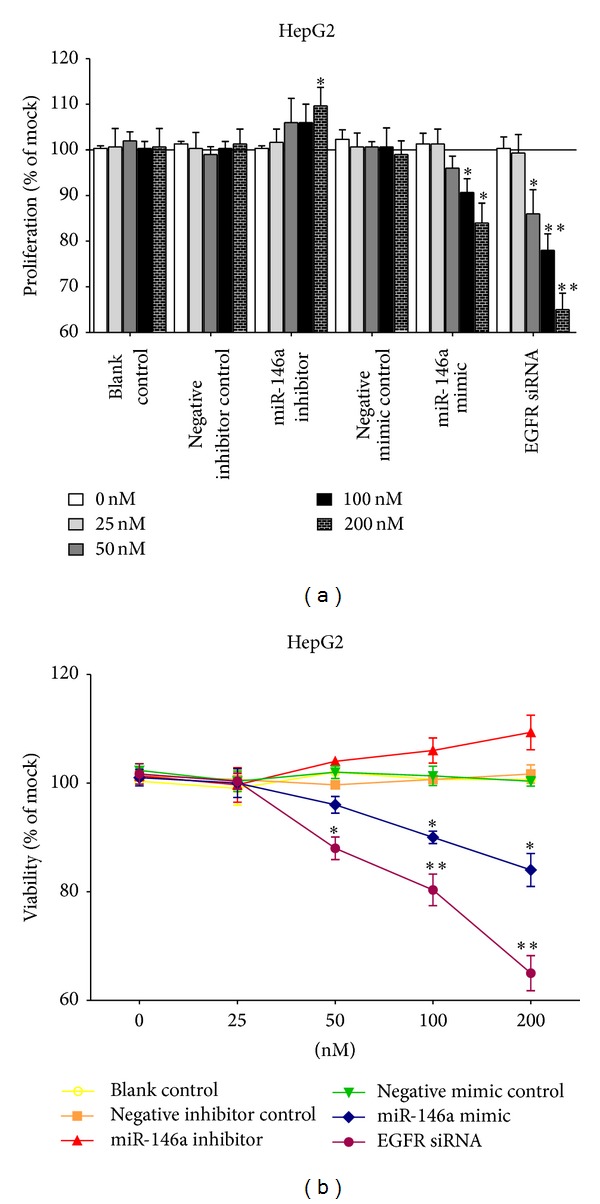
Figure 4.

Dose dependent effect of miR-146a on cell growth in HCC cell line HepG2. HepG2 cells (2.5 × 10³ cells per well in 96-well plate) were cultured for 24 h and transfected with miR-146a inhibitor, miR-146a mimic, EGFR siRNA, and their negative controls with increasing concentrations for 96 h (0–200 nM). (a) Cell proliferation tested with MTS assay. (b) Cell viability detected using fluorimetric detection of resorufin (CellTiter-Blue Cell Viability Assay). *P < 0.05, **P < 0.01, compared to blank and negative controls with the same concentration.
