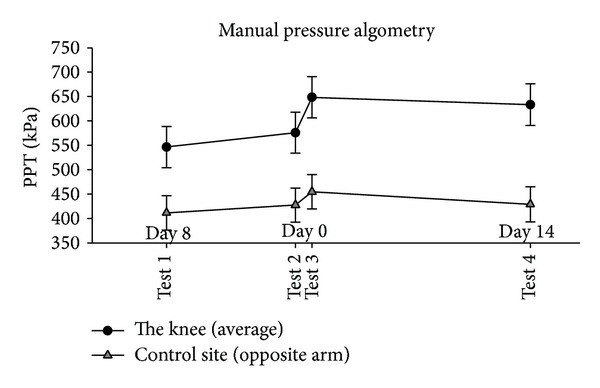
Figure 3.

Mean manual PPTs (95% CI, N = 25 at tests 1, 2, and 3; N = 24 at test 4) at the knee (filled circles) and the contralateral arm (control site—open triangles) before (baseline tests 1 and 2), immediately after (test 3), and two weeks after (test 4) the injection of lidocaine and glucocorticosteroid. PPT was significantly increased at the knee immediately after (test 3) (P < 0.0001) and two weeks after (test 4) (P = 0.005), but not at the control site (P > 0.084), compared with baseline 2 (test 2).
