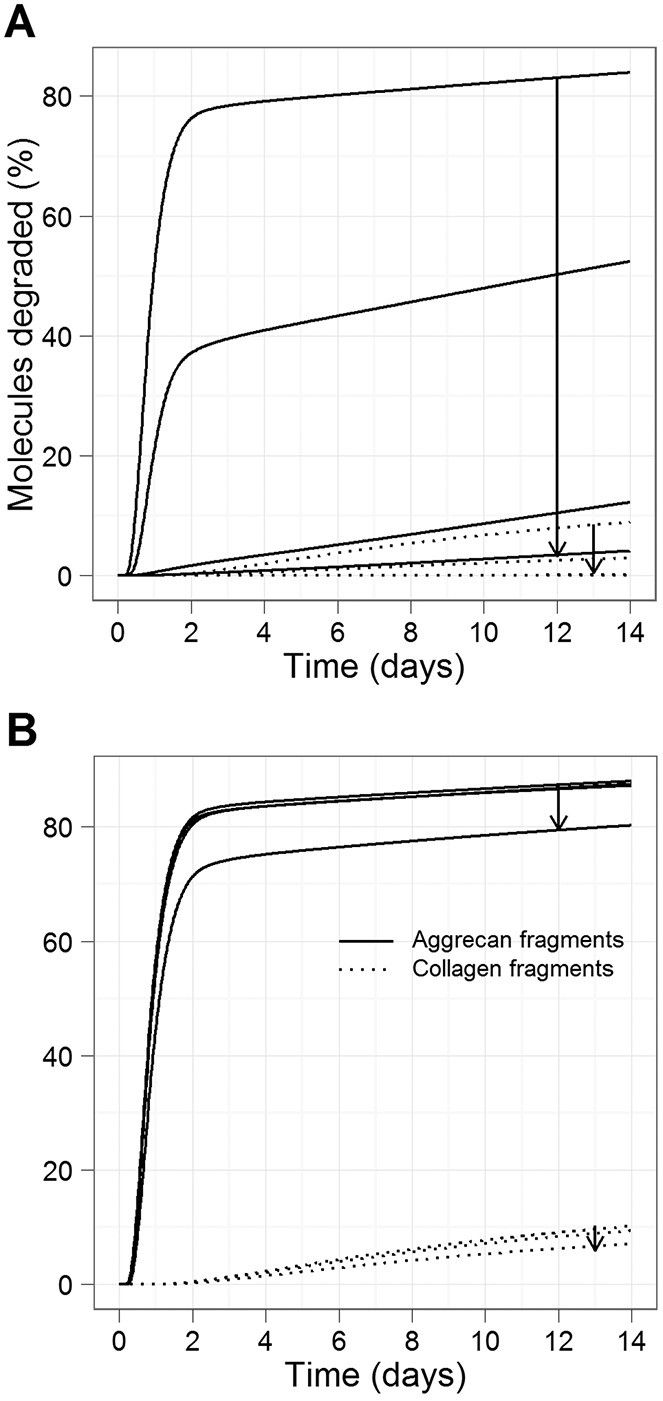
Figure 3.

Simulation results for interventions with interleukin-1 receptor (IL-1R) or oncostatin M receptor (OSMR) antagonists, using a simulated time period of 14 days. Simulated conditions consisted of IL-1 plus OSM plus matrix metalloproteinase activator. Curves show the percentage of aggrecan and collagen degraded. A, Effect of IL-1R antagonist. B, Effect of OSMR antagonist. Arrows in A and B show the direction of increase in the ratio of receptor antagonist to receptor (1, 10, 100, 1,000).
