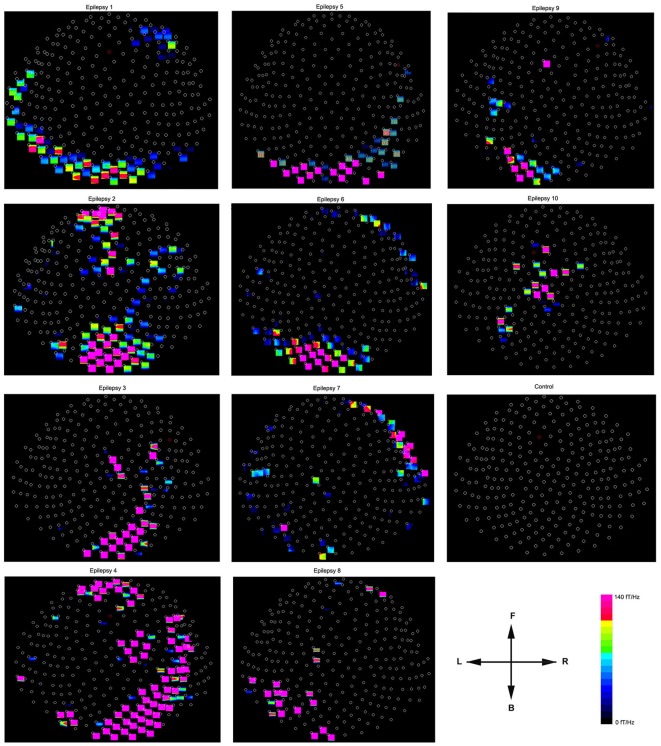
Figure 6.
Accumulated spectral contour maps from 10 epilepsy subjects and 1 healthy subject show the spatial distributions. Noticeably, the spectral distribution varies across patients. All the contour maps have the same orientation defined by the arrows: the “L” indicates the left side of the head and the “R” indicates the right side of the head. The “F” indicates that the upper part of the contour map represents the frontal region of the head; the “B” indicates that the lower part of the contour map represents the posterior region of the head. Each small circle represents one MEG sensor. The color bar shows the color coding of spectral power for all the contour maps.

