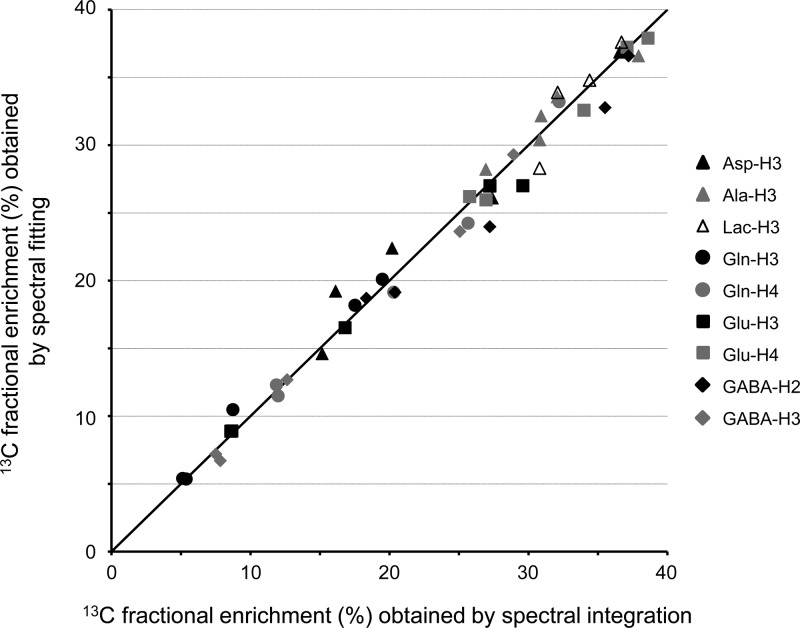
Figure 2.
Correlation between the 13C fractional enrichments obtained by spectral integration on column-separated samples and spectral fitting on nonseparated samples. Nine multiplets from five samples are displayed. The samples were obtained from rat brain extracts following 15 (n = 1), 30 (n = 2) and 60 (n = 2) minutes of [1-13C]-glucose infusion. The solid line represents the identity line. The best linear fit is characterized by a slope of 0.975 and an intercept of 0.437% (R = 0.992). The exact 13C fractional enrichments can be found in Table S1 (Supporting Information).

