Figure 1.
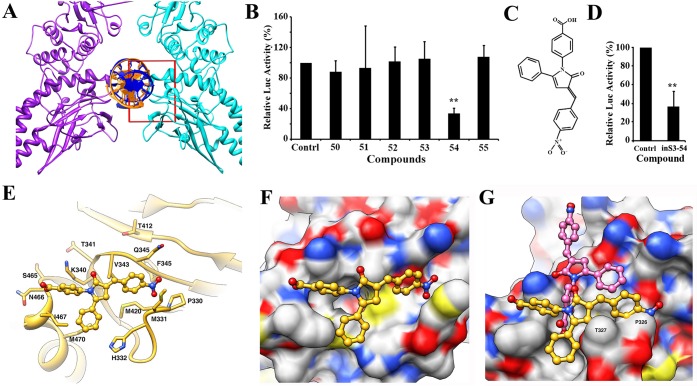
Schematic diagram and identification of inS3-54 by virtual screening. (A) DNA-STAT3 complex structure (PDB code: 1BG1). The red box shows the site for docking in one of the STAT3 subunits. (B) Luciferase activity assay of MDA-MB-231 cells harboring stable STAT3-dependent luciferase reporter following treatment with DMSO control or 20 μM compounds for 48 h. (C) Structure of inS3-54. (D) Luciferase activity assay of H1299 cells transiently transfected with STAT3-dependent luciferase reporter following treatment with DMSO control or 20 μM inS3-54 for 48 h. (E) Simulated average complex structure of inS3-54 in the DBD of STAT3. (F, G) Molecular surface of STAT3 (F) and STAT1 (G) complexed with inS3-54 from MD simulation with orientation shown in gold for STAT3 and pink for STAT1. Molecular surface is colored with gray for carbon, blue for nitrogen, red for oxygen, and yellow for sulfur. (**p < 0.01)

