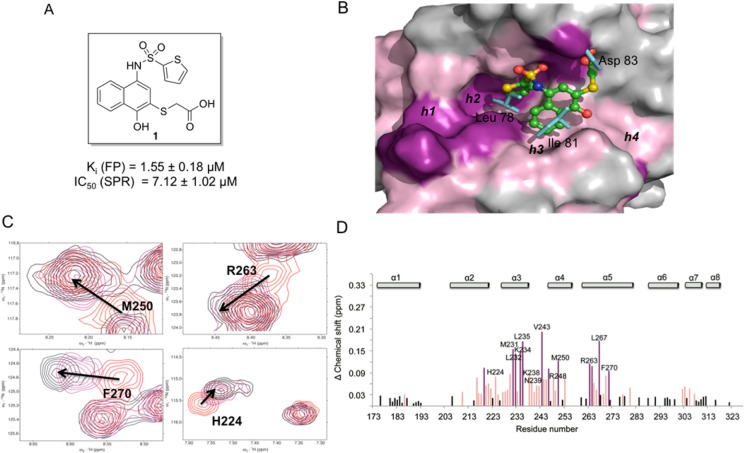
Figure 1.
(A) Structure of the HTS lead compound 1. (B) Putative binding mode of 1 to Mcl-1(PDB ID: 2NLA). Side chains residues of mNoxa peptide are shown in blue sticks. The surface of Mcl-1 protein is colored according to the chemical shift intensity. Significant shift (>0.09 ppm) is represented with purple, moderate shift (≥0.03 and ≤0.09 ppm) represented with pink. (C) Overlaid 15N–1H HSQC spectra of Mcl-1 (red) and in the presence of 1 (Mcl-1:1 ratio of 1:2) (black), (Mcl-1:1 ratio of 1:1) (purple). Arrows show the direction of chemical shift changes upon binding of 1. (D) Plot of chemical shift changes of Mcl-1 amide upon addition of 1 (Mcl-1:1 ratio of 1:2) as a function of Mcl-1 residue numbers.

