
Figure 3.
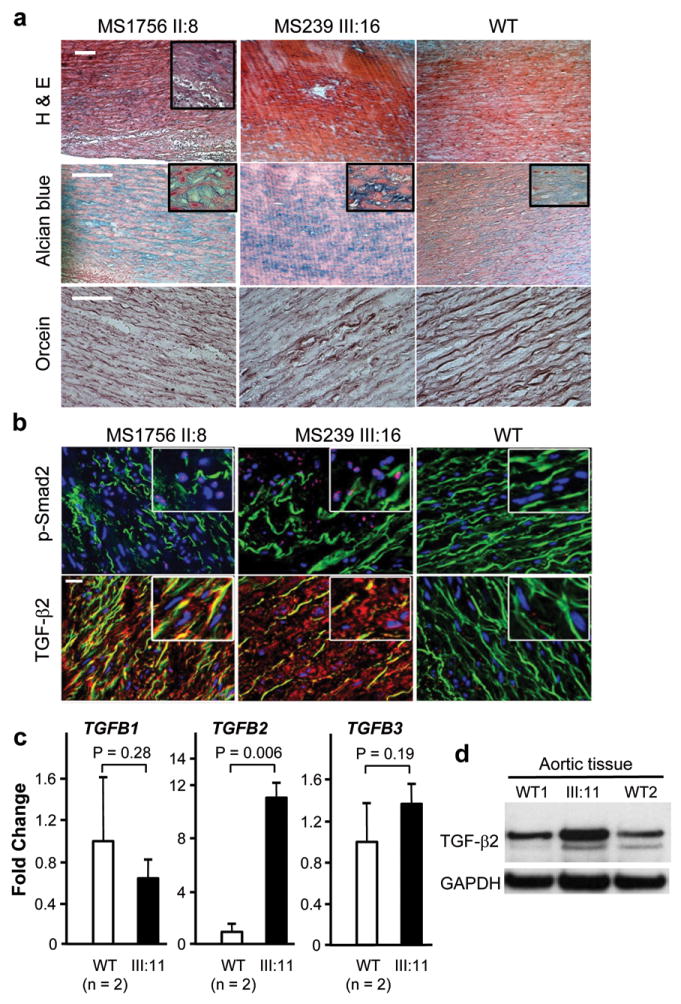
Aortic pathology and assessment of TGF-β signaling in patients with TGFB2 mutations. (a) Histology of aortic media from a dissection case (left column) with a TGFB2 mutation resulting in p.Glu102* (II:8, MS1756), an aneurysm case (middle column) with a TGFB2 mutation resulting in p.Cys229* (III:16, MS239 family), and a control (right column). Hematoxylin-eosin (H&E) staining displays disorganization of the aortic media with loss of SMCs and alcian blue reveals proteoglycan accumulation (blue). Note the loss, disarray and fragmentation of elastin fibers versus control with orcein staining. The white scale bars in the upper left pictures are 100μm. (b) Immunohistofluorescent staining for the same patients and control samples. Elastin fibers appear in green (autofluorescence), while nuclei are counterstained blue. Nuclear pSMAD2 staining (pink, upper panel) is present in the disease tissues and is absent in the control aorta. The lower panel shows the intense immunostaining for TGF-β2 using a polyclonal antibody specific for TGF-β2. Staining for pSMAD2 and TGF-β2 is located in the most disorganized areas of the aortic wall. The white scale bar in the upper left picture is 20μm. (c) The expression of TGFB1, TGFB2 and TGFB3 was assayed by Q-PCR using RNA isolated from the aorta of III:11 from TAA288. The expression of TGFB2 was increased over 10-fold when compared to aortic tissue isolated from controls aortas. Gene expression levels are standardized to GAPDH. The relative expression values were determined via the ΔΔCt method, and assays were performed in triplicate. Data are expressed as mean ± standard error of the mean for pooled experimental results. (d) Immunoblot analysis of the mutant and control aortas showed increased levels of the 47 kD TGF-β2 protein band in the patient’s aorta compared with two control aortas using a TGF-β2 specific antibody. Data are expressed as mean ± standard error of the mean for experimental results.